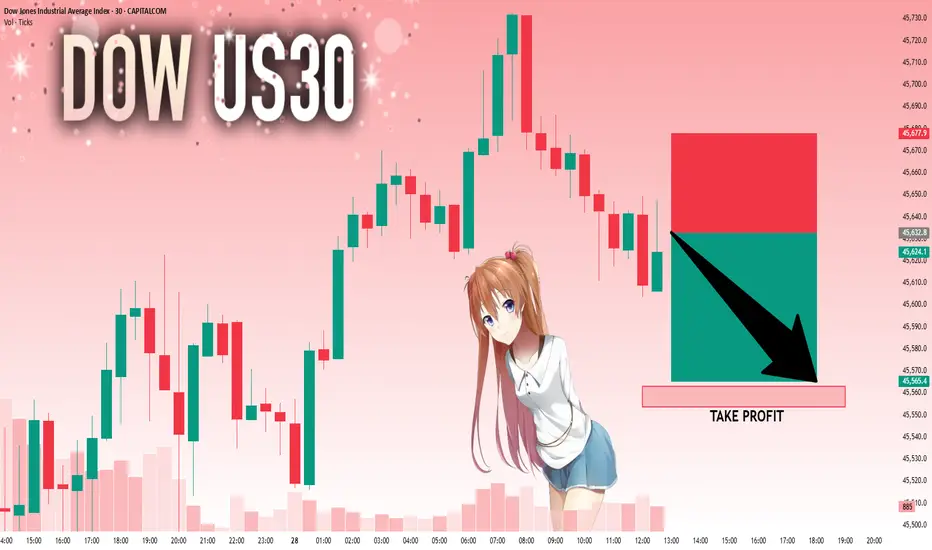
Us30 Trade Set Up Aug 28 2025FX:US30
www.tradingview.com
Price has made HH/HL on the 1h so if price can remain above HL and the 1h FVG i can see it testing BSL before coming down but if price can close under HL and invert 1h FVG i will look for sells down to SSL and PDL
DJ30 trade ideas

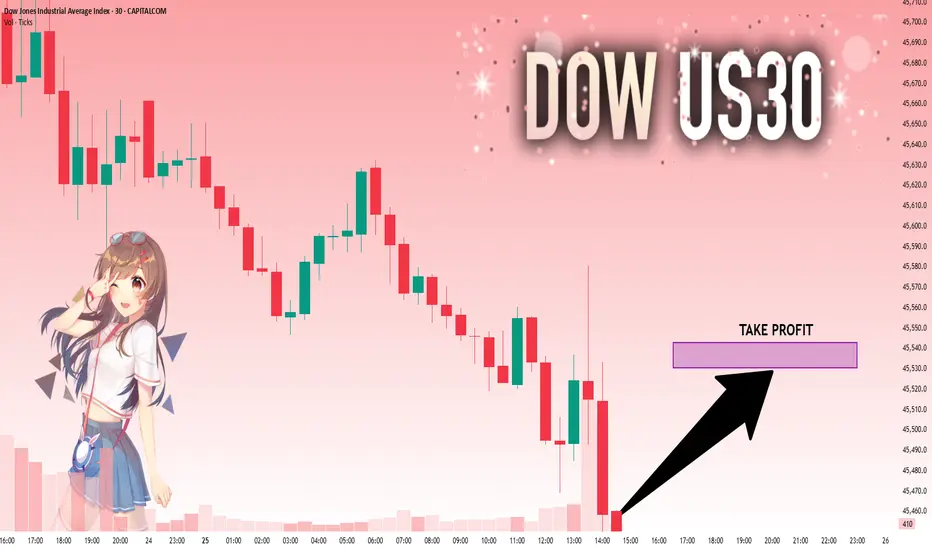
US30: Target Is Down! Short!
My dear friends,
Today we will analyse US30 together☺️
The recent price action suggests a shift in mid-term momentum. A break below the current local range around 45,632.8 will confirm the new direction downwards with the target being the next key level of 45,563.0 and a reconvened placement of a stop-loss beyond the range.
❤️Sending you lots of Love and Hugs❤️

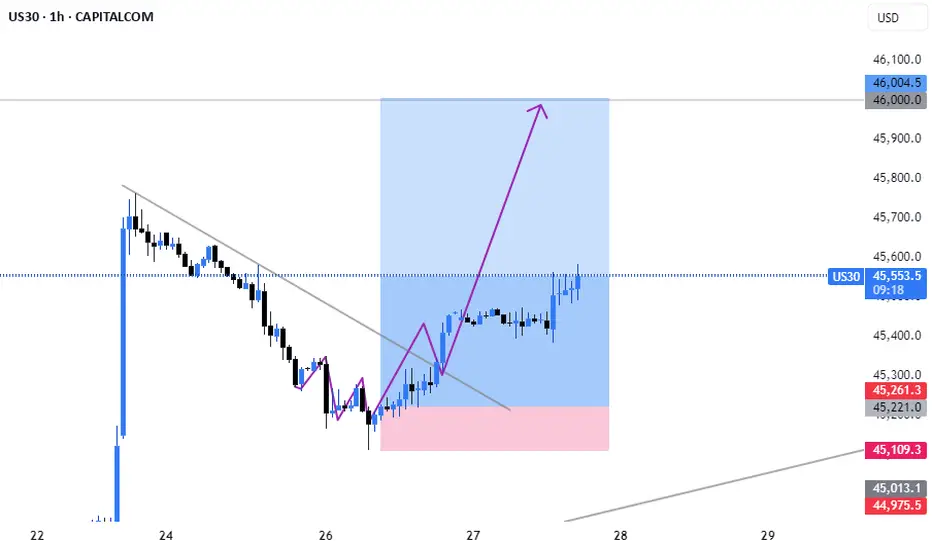
UPDATE ON LONG DJ / US30 READING Continuation after a PullBack On H1 timeframe
Another Entry can be done on the current Trend Line to the upside.
After a Breakout to the upside which is still valid for a Buy trade
Entry Price .... $45,230.00
DJ / US30... $45,230.0
S/L ...$45,100.00
T/P ...$45,320.0
First Take Profit with Price $45,320, has been hit in huge profits
Trade is still running in more profits to hit final target price of $46,000.0
Also looking at a final touch to $46,000.0 LEVEL.
And More
Dow Jones Breaks Out of Inverse Head & Shoulders, Eyeing FurtherThe Dow Jones Index has confirmed a breakout from the classic Inverse Head and Shoulders pattern, signaling a potential trend reversal to the upside. The neckline breakout, supported by rising trading volumes, adds strength to the bullish outlook and paves the way for a more sustained upward move. If the index holds above this key level, further capital inflows could drive the Dow toward higher targets in the medium term.

Short idea.This idea is based on fibonachi indicator. I was waiting for price to come back up and it did sooner than I expected.

Us30 Trade Set UP Aug 27 2025FX:US30
www.tradingview.com
Us30 is approaching a 1h FVG, if it respects it, i will look for internal sweep of SSl followed by 1m-2m IFVG to target higher BSL levels but if price inverts the 1h FVG(closes under 50% of FVG) i will look for sells towards PDL

US30 Technical Breakdown – 08/27/2025📍 US30 Technical Breakdown – 08/27/2025
US30 bounced strong off 44,900 support and ripped back above 45,300, reclaiming momentum after yesterday’s pullback. Currently sitting at 45,421, price is consolidating just under the EMAs and eyeing another push higher.
Bulls want continuation toward 45,600–45,761, while bears need to force price back below 45,200 to regain control.
📊 Current Market Behavior:
📈 Strong recovery bounce from 44,894 support
🔄 Consolidation between 45,200–45,450
📊 EMAs starting to curl bullish again
⚠️ Momentum cautious after sharp rejection from 45,761
📌 Key Levels:
🔹 Resistance Zones:
45,450 → Intraday pivot resistance
45,600 → Pre-breakout supply
45,761 → Major rejection high
🔹 Support Zones:
45,200 → EMA support & intraday demand
44,894–44,704 → Strong support cluster
43,982 → Deeper demand zone
🧠 Bias:
📈 Slightly Bullish Intraday
Above 45,200 keeps upside structure intact
Failure back below 45,200 flips bias bearish

Us30 1500 pips set upFX:US30
www.tradingview.com
was a slow day but out set up played out securing a total of 1500 pips
the target was buy side liquidity

US30: Next Move Is Up! Long!
My dear friends,
Today we will analyse US30 together☺️
The recent price action suggests a shift in mid-term momentum. A break above the current local range around 45,456.4 will confirm the new direction upwards with the target being the next key level of 45,530.6 and a reconvened placement of a stop-loss beyond the range.
❤️Sending you lots of Love and Hugs❤️
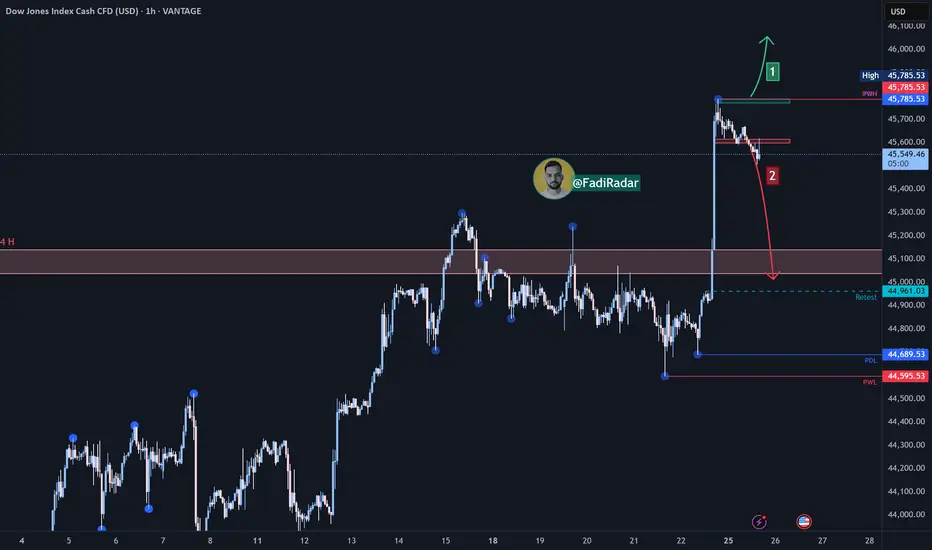
US30 / Dow Jones Technical AnalysisThe Dow Jones index is currently in a general uptrend, with a downward corrective movement on the hourly timeframe.
1️⃣ Bullish Scenario:
If we see bullish momentum and the price holds above 45,700, the index may target 46,000, with continued buying pressure potentially opening the way toward 46,200.
2️⃣ Bearish Scenario:
However, if the price remains below 45,600, this could push the index to test the 44,950 area.
US30 Breaks Above 45,000 After Fed Chair’s SpeechFollowing the Fed Chair’s comments at Jackson Hole, US30 surged higher, breaking through the 45,000.0 resistance zone with strong bullish momentum.
Support at: 45,000.0 | 44,000.0 | 43,323.5 | 41,900.0 | 37,700.0
Resistance at: 46,000.0 (psychological round number above current charted levels)
🔎 Bias:
Bullish: Sustained price action above 45,000.0 could open the door for a run toward 46,000.0.
Bearish: If price fails to hold above 45,000.0, a retest of 44,000.0 may follow.
📛 Disclaimer: This is not financial advice. Trade at your own risk.

US30 Long Opportunity US30 has been on a bullish tear recent and after the speech by Powell, the market has turned on the bullish momentum to the max. the market is currently on an impulse to the the upside and has created new highs.
Price has broken the $45000 pivot level and continues to trade above the 21, 50 and 200 SMA and in the bullish region of the RSI, currently sitting in the overextended levels at 80.
it is clear the market is in need of a deep retracement to collect liquidity and i will be target the $45000-$5250 zone for a potential zone opportunity. Waiting to see how price reacts to the level and will ride the wave pass the $445652 mark.

US30 LongUS30: New ATH Prints – Waiting for Weekly Candle Retracement
The US30 has surged to fresh all-time highs (ATH), closing last week with a strong bullish weekly momentum candle. This kind of aggressive move often sees follow-through, but smart money typically waits for a retracement to optimize entries.
Plan & Levels:
The area around $45,300 stands out as a potential buying zone, aligning with expected dollar weakness and a key Fibonacci retracement level of the prior weekly push.
Traders will watch for price to pull back toward this zone and confirm entries using lower timeframe candlestick patterns and confluence with Fibonacci support.
Technical Context:
Momentum remains firmly bullish, with higher highs and strong breadth across industrial and tech components supporting the rally.
A controlled retracement would provide fresh liquidity for continuation and could set the stage for another leg higher toward new records.
Trading Plan:
Wait for a retracement toward $45,300 to build a long position.
Validate entries using Fibonacci levels and bullish reversal candles on 4H or lower charts.
Maintain disciplined risk management, as overextended markets can show sharp pullbacks before continuation.


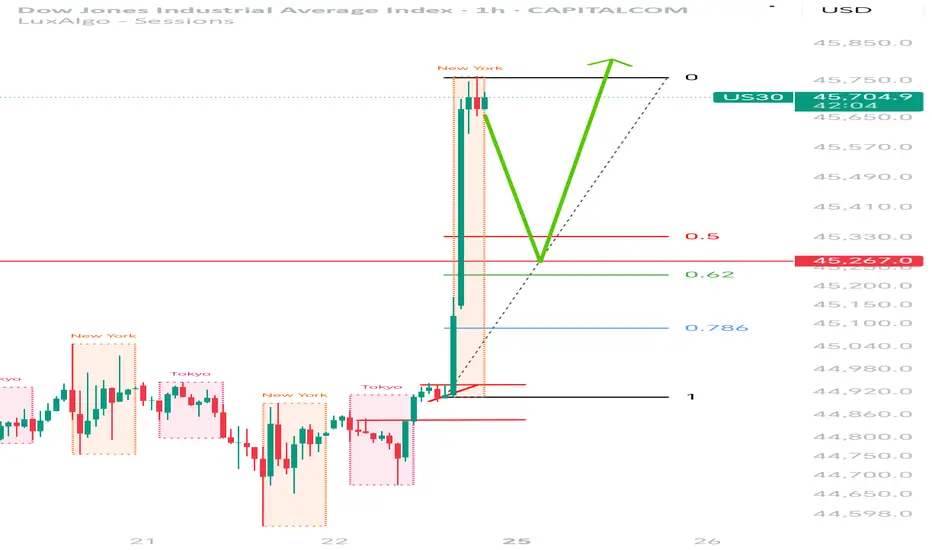
US30 New Record HighUS30 has registered a new record high.
I'm anticipating price to retrace towards the previously broken resistance level, which could act as a new support zone upon retest. I've pulled out my Fibonacci retracement tool📉📊, with particular attention to the golden ratio levels (0.618–0.65) as potential areas of interest for trade execution.🚀🎯🔥
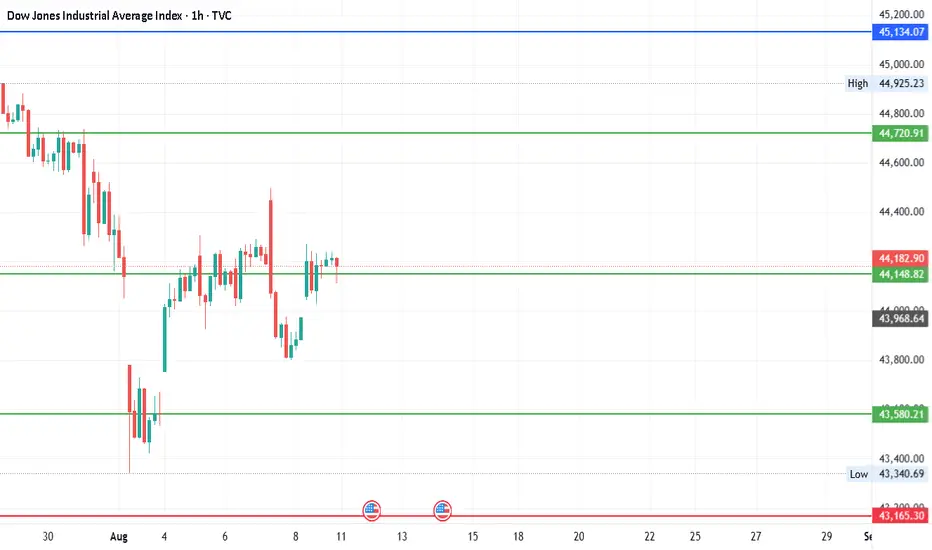
#DJI - Levels for Aug 2025Date: 09-08-2025
#DJI - Current Price: 44175.61
Pivot Point: 44149 Support: 43580 Resistance: 44721
#DJI Upside Targets:
| 🎯 Target 1 | 45134 |
| 🎯 Target 2 | 45547 |
| 🎯 Target 3 | 46072 |
| 🎯 Target 4 | 46596 |
#DJI Downside Targets:
| 🎯 Target 1 | 43165 |
| 🎯 Target 2 | 42750 |
| 🎯 Target 3 | 42226 |
| 🎯 Target 4 | 41702 |
#TradingView #Nifty #BankNifty #DJI #NDQ #SENSEX #DAX #USOIL #GOLD #SILVER
#BHEL #HUDCO #LT #LTF #ABB #DIXON #SIEMENS #BALKRISIND #MRF #DIVISLAB
#MARUTI #HAL #SHREECEM #JSWSTEEL #MPHASIS #NATIONALUM #BALRAMCHIN #TRIVENI
#USDINR #EURUSD #USDJPY #NIFTY_MID_SELECT #CNXFINANCE
#SOLANA #ETHEREUM #BTCUSD #MATICUSDT #XRPUSDT
#Crypto #Bitcoin #BTC #CryptoTA #TradingView #PivotPoints #SupportResistance
US3o Trade Set Up Aug 22 2025www.tradingview.com
FX:US30
Us30 Trade Set Up: price is making HH/HL on the 1h and is close to testing PDH, so i will wait to see if price closes above HH and PDH to continue higher towards BSL or if price sweeps PDH as liquidity, closes under and forms internal IFVG+CISD to go lower towards HL/PDL

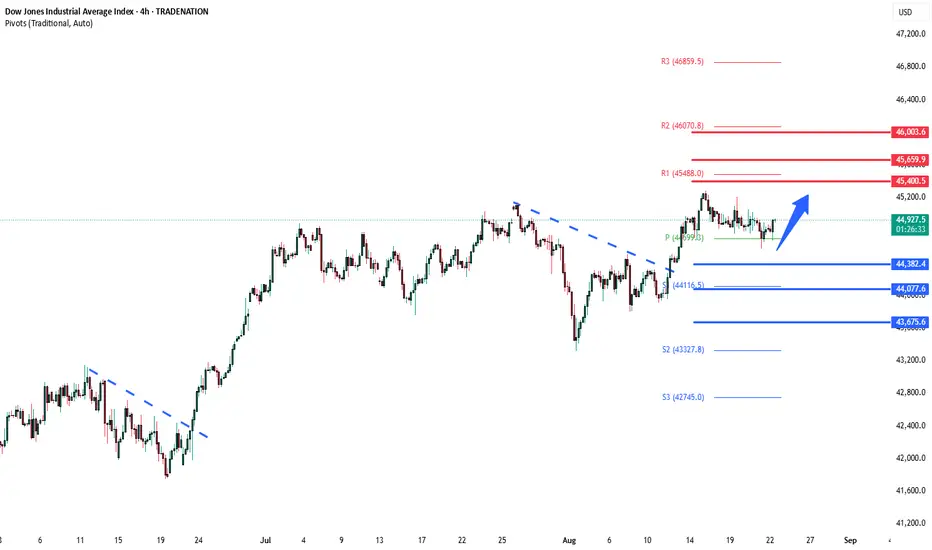
DowJones Key Trading levels ahead of Powell's testimonyKey Support and Resistance Levels
Resistance Level 1: 45400
Resistance Level 2: 45660
Resistance Level 3: 46000
Support Level 1: 44380
Support Level 2: 44080
Support Level 3: 43675
This communication is for informational purposes only and should not be viewed as any form of recommendation as to a particular course of action or as investment advice. It is not intended as an offer or solicitation for the purchase or sale of any financial instrument or as an official confirmation of any transaction. Opinions, estimates and assumptions expressed herein are made as of the date of this communication and are subject to change without notice. This communication has been prepared based upon information, including market prices, data and other information, believed to be reliable; however, Trade Nation does not warrant its completeness or accuracy. All market prices and market data contained in or attached to this communication are indicative and subject to change without notice.
US30-ShortBecause Powell is not lowering interest rates and due to seasonality factor US30 is a clear short in the month of August
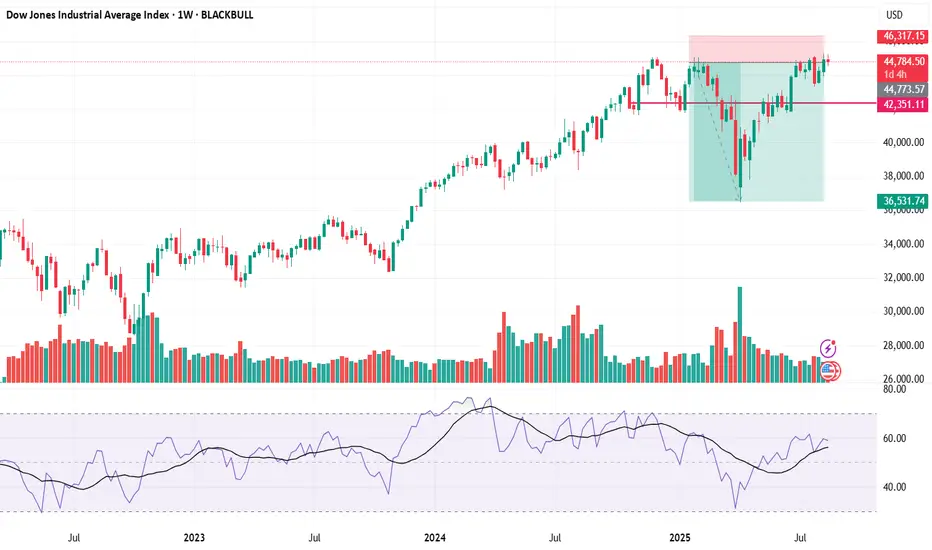
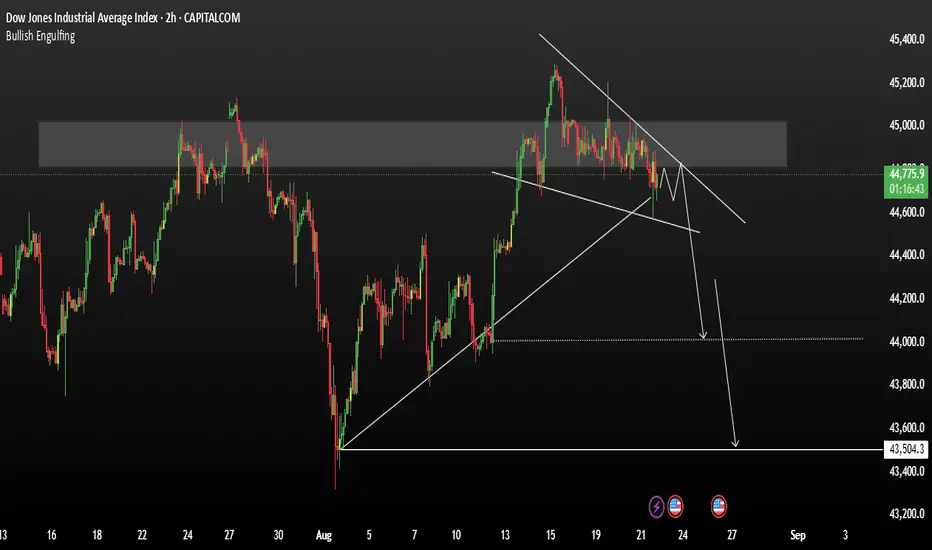
US30 breaks below the current market structureUS30 On the left side of the chart, we observed that after breaking below the second major pattern, the US30 experienced a sharp and aggressive decline. A similar structure appears to be forming once again, and notably, the index has just printed another all-time high.
If the price breaks below the current market structure—mirroring the previous breakdown—there is a strong possibility of another significant sell-off. This scenario becomes more likely if we see a clear shift in momentum toward the bearish side.
A confirmed breakdown could trigger a repeat of the past decline, especially if key support levels fail to hold and bearish volume increases.
You may find more details ion the chart.
Trade wisely best of Luck .
Ps; Support with like and comments for better analysis Thanks for supporting.
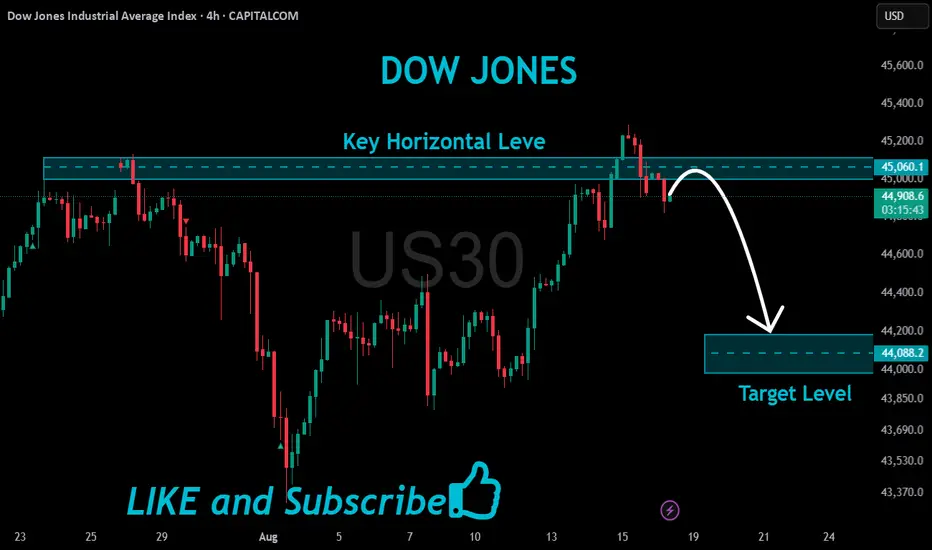
US30 Bearish Breakout!
HI,Traders !
#US30 made a bearish
Breakout of the key horizontal
Level of 45060.1 which is now
A resistance and the breakout
Is confirmed so we are bearish
Biased and we will be expecting
A further bearish move down !
Comment and subscribe to help us grow !
US30 Short Trade - Important to hit 44,600CAPITALCOM:US30 Short Trade
Entry: 44930 - 45,008
TP: 44,600
This is good trade.
Don't overload your risk like Greedy gambler!!!
Be Disciplined Trader, what what you can afford.
Use proper risk management.
Disclaimer: Trading is risky, only idea, not advice.
