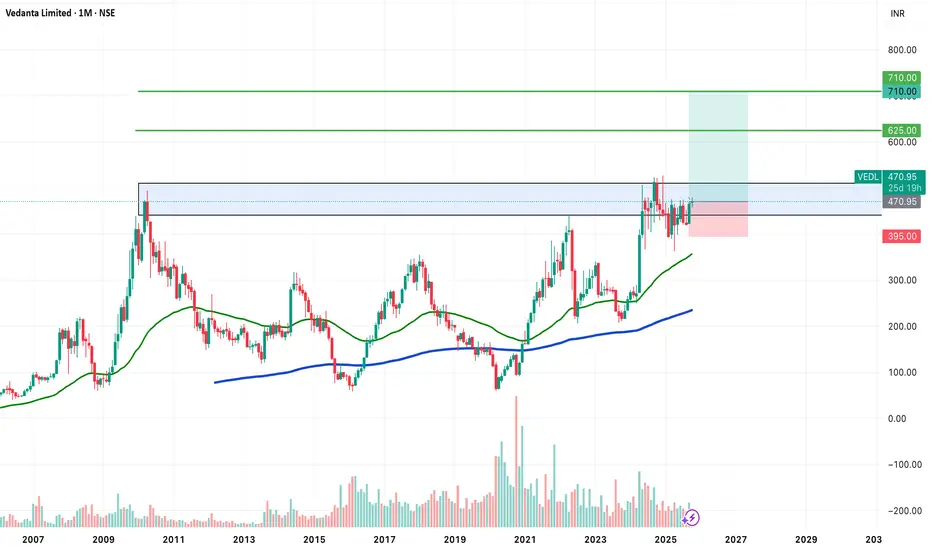
VEDANTAThis seems to have good rally in market
Entry is already made in it and i m late to post it but if some want to buy can buy @603-605
target will be 624-640
stoploss will be 590 closing basis
Hope trade brings good return
do comment your views on it
Thankyou
Next report date
—
Report period
—
EPS estimate
—
Revenue estimate
—
36.30 INR
149.88 B INR
1.54 T INR
1.62 B
About Vedanta Limited
Sector
Industry
Website
Headquarters
Mumbai
Founded
1965
IPO date
Apr 16, 1981
Identifiers
2
ISIN INE205A01025
Vedanta Ltd. is a natural resource company, which engages in the exploration, extraction, and processing of minerals, oil, and gas properties. It operates through the following segments: Copper, Aluminum, Iron Ore, Power, and Oil & Gas. The Copper segment focuses in custom smelting and also include a copper smelter, a refinery, a phosphoric acid plant, a sulphuric acid plant, a copper rod plant, and three captive power plants. The Aluminum segment comprises refinery and a captive power plant at Lanjigarh and a smelter, a thermal coal based captive power facility at Jharsuguda both situated in the State of Odisha in India. The Iron Ore segment explores, mines, and processes iron ore, pig iron, and metallurgical coke. The Power segment consists 600 MW thermal coal-based commercial power facility at Jharsuguda in the State of Odisha in Eastern India. The Oil and Gas segment involves in the exploration and development and production of oil and gas. The company was founded by Dwarka Prasad Agarwal on June 25, 1965 and is headquartered in Mumbai, India.
Related stocks

Vedanta, 1D, ATH, Long, VolumesVendanta is at its ATH with good volumes. Enter the stock it it breaks it's ATH of 680 for the target of 705-710.
Entry: 680
Target 705-710

Vedanta BreakoutVedanta is breaking out of multi year FLAG. Conservative targets of 765 and 930. Can do 1200 as well.

Vedanta - My Stock Pick for 2026Starting the year at ATH. Coming out of 15 year period of consolidation.
Look for dips till 530 to enter.
Target: 765 / 1200
Support: 530 / 495 / 360
Below 495 exit temporarily and buyback on reversal above 530.
Disclaimer: I have entered the trade around 606. Looking for dips to build on posit

Review and plan for 30th January 2026Nifty future and banknifty future analysis and intraday plan.
This video is for information/education purpose only. you are 100% responsible for any actions you take by reading/viewing this post.
please consult your financial advisor before taking any action.
----Vinaykumar hiremath, CMT

Important levels for vedenta limitedMarked few important levels in the chart that is worth remembering.

VEDL – Ready for Fresh Upside Momentum📲 VEDL – Ready for Fresh Upside Momentum
After breaking its all-time high, VEDL went into a healthy retest & consolidation phase and has now formed a rounding bottom, coming back near its all-time high zone again — signalling renewed strength for the next leg up.
📌 Trade / Investment Plan
• CMP: ₹

POSITIONAL IDEA - VEDANTA (VEDL)Vedanta Ltd , one of India’s leading diversified natural resources companies, is showing a strong long-term breakout setup supported by powerful technical signals.
Reasons are listed below :
Attempting a multi-year breakout after nearly 14 years of consolidation
Potential VCP (Volatility Contr
Vedanta : All time High !!!
Vedanta : All Time High !!!
( Not a Buy / Sell Recommendation
Do your own due diligence ,Market is subject to risks, This is my own view and for learning only .)

VEDL - Bullish - TGT 555VEDL is expected to hit the level of 555 or even higher.
The Share expected to retrace to the levels of 345 before flying higher.

See all ideas
Summarizing what the indicators are suggesting.
Neutral
SellBuy
Strong sellStrong buy
Strong sellSellNeutralBuyStrong buy
Neutral
SellBuy
Strong sellStrong buy
Strong sellSellNeutralBuyStrong buy
Neutral
SellBuy
Strong sellStrong buy
Strong sellSellNeutralBuyStrong buy
An aggregate view of professional's ratings.
Neutral
SellBuy
Strong sellStrong buy
Strong sellSellNeutralBuyStrong buy
Neutral
SellBuy
Strong sellStrong buy
Strong sellSellNeutralBuyStrong buy
Neutral
SellBuy
Strong sellStrong buy
Strong sellSellNeutralBuyStrong buy
Displays a symbol's price movements over previous years to identify recurring trends.
931VL27
Vedanta Limited 9.31% 03-DEC-2027Yield to maturity
—
Maturity date
Dec 3, 2027
874VL32
Vedanta Limited 8.74% 29-JUN-2032Yield to maturity
—
Maturity date
Jun 29, 2032
95VL27
Vedanta Limited 9.5% 20-AUG-2027Yield to maturity
—
Maturity date
Aug 20, 2027
945VL28
Vedanta Limited 9.45% 05-JUN-2028Yield to maturity
—
Maturity date
Jun 5, 2028
94VL27
Vedanta Limited 9.4% 20-FEB-2027Yield to maturity
—
Maturity date
Feb 20, 2027
92VL30
Vedanta Limited 9.2% 25-FEB-2030Yield to maturity
—
Maturity date
Feb 25, 2030
VL050625
Vedanta Limited FRN 04-JUN-2027Yield to maturity
—
Maturity date
Jun 4, 2027
See all VEDL bonds
DVYE
iShares Emerging Markets Dividend Index Fund Exchange Traded FundWeight
2.85%
Market value
35.63 M
USD
Explore more ETFs
Frequently Asked Questions
The current price of VEDL is 673.65 INR — it has decreased by −4.14% in the past 24 hours. Watch Vedanta Limited stock price performance more closely on the chart.
Depending on the exchange, the stock ticker may vary. For instance, on NSE exchange Vedanta Limited stocks are traded under the ticker VEDL.
VEDL stock has risen by 4.77% compared to the previous week, the month change is a 4.12% rise, over the last year Vedanta Limited has showed a 58.51% increase.
We've gathered analysts' opinions on Vedanta Limited future price: according to them, VEDL price has a max estimate of 900.00 INR and a min estimate of 635.00 INR. Watch VEDL chart and read a more detailed Vedanta Limited stock forecast: see what analysts think of Vedanta Limited and suggest that you do with its stocks.
VEDL reached its all-time high on Jan 29, 2026 with the price of 769.80 INR, and its all-time low was 0.95 INR and was reached on Oct 24, 2000. View more price dynamics on VEDL chart.
See other stocks reaching their highest and lowest prices.
See other stocks reaching their highest and lowest prices.
VEDL stock is 6.07% volatile and has beta coefficient of 1.58. Track Vedanta Limited stock price on the chart and check out the list of the most volatile stocks — is Vedanta Limited there?
Today Vedanta Limited has the market capitalization of 2.74 T, it has increased by 0.64% over the last week.
Yes, you can track Vedanta Limited financials in yearly and quarterly reports right on TradingView.
Vedanta Limited is going to release the next earnings report on May 8, 2026. Keep track of upcoming events with our Earnings Calendar.
Vedanta Limited revenue for the last quarter amounts to 466.51 B INR, despite the estimated figure of 435.94 B INR. In the next quarter, revenue is expected to reach 491.80 B INR.
VEDL net income for the last quarter is 57.10 B INR, while the quarter before that showed 17.98 B INR of net income which accounts for 217.58% change. Track more Vedanta Limited financial stats to get the full picture.
Vedanta Limited dividend yield was 9.37% in 2024, and payout ratio reached 111.63%. The year before the numbers were 10.86% and 258.74% correspondingly. See high-dividend stocks and find more opportunities for your portfolio.
As of Feb 14, 2026, the company has 117.26 K employees. See our rating of the largest employees — is Vedanta Limited on this list?
EBITDA measures a company's operating performance, its growth signifies an improvement in the efficiency of a company. Vedanta Limited EBITDA is 382.96 B INR, and current EBITDA margin is 28.51%. See more stats in Vedanta Limited financial statements.
Like other stocks, VEDL shares are traded on stock exchanges, e.g. Nasdaq, Nyse, Euronext, and the easiest way to buy them is through an online stock broker. To do this, you need to open an account and follow a broker's procedures, then start trading. You can trade Vedanta Limited stock right from TradingView charts — choose your broker and connect to your account.
Investing in stocks requires a comprehensive research: you should carefully study all the available data, e.g. company's financials, related news, and its technical analysis. So Vedanta Limited technincal analysis shows the neutral today, and its 1 week rating is buy. Since market conditions are prone to changes, it's worth looking a bit further into the future — according to the 1 month rating Vedanta Limited stock shows the buy signal. See more of Vedanta Limited technicals for a more comprehensive analysis.
If you're still not sure, try looking for inspiration in our curated watchlists.
If you're still not sure, try looking for inspiration in our curated watchlists.