VeChain Near Support, 17% Rally Could Push Price 0.029Hello✌️
Let’s analyze VeChain’s price action both technically and fundamentally 📈.
🔍Fundamental analysis:
VeChain (VET) staking grows fast with StarGate, shrinking supply. The challenge is keeping momentum once rewards stop in Dec 2025.
📊Technical analysis:
BINANCE:VETUSDT is currently


VET - UPDATENYSE:VET - update:
Same as - daily rejection at resistance happened🔴
Very neutral area D1.
I remain bullish above the daily uptrend & more likely 0.02300$ support zone!

VeChain (VET): Expecting Bullish CME To Be FilledVET recently formed a bullish CME gap, which will most likely be filled very soon. But as markets are bearish currently, we are looking for price to reach the support zone first, where some kind of MSB could form and trigger a decent upside move.
Swallow Academy

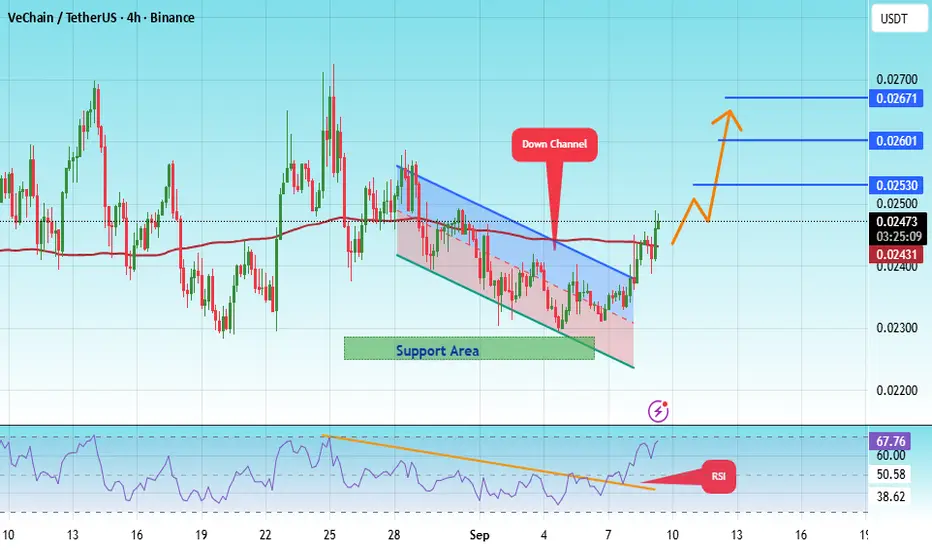
#VET/USDT Traders watch VeChain 20% upside targeting 0.02671 ?#VET
The price is moving within a descending channel on the 4-hour frame, adhering well to it, and is heading for a strong breakout and retest.
We have a bearish trend on the RSI indicator that is about to be broken and retested, which supports the upward breakout.
There is a major support area i
#VET Traders watch VeChain 20% upside targeting 0.02676 soon#VET
The price is moving in an ascending channel on the 1-hour frame, adhering well to it, and is heading for a strong breakout and retest.
0.02228
We have a bearish trend on the RSI indicator that is about to be broken and retested, supporting the upside.
There is a major support area in green a

VeChain (VET): Waiting For Break of 200EMAVET is trading right below the 200EMA, which has been acting as the main barrier for weeks now. Once buyers secure a clean break above this level, we should see a strong impulse move to the upside.
This is exactly the kind of setup where patience pays — we wait for that decisive breakout, and then

VETUSDT: Start ALTIt seems like the alt season is coming. After Bitcoin and then Ethereum surged, some coins are ready to take off, like this currency.

VeChain Ready for U.S. Breakout and RWA RunTechnically, VET has been coiling for years, and a breakout above $0.03 could rip through $0.09, then sprint toward $0.28. In a full-blown bull run, with Salesforce integration, PwC U.S. access, and VeChain’s role in real world assets like supply chain and carbon tracking, $0.75 is not a meme number

VET : BUY SPOTThe candles are compressing on the daily timeframe. Given the positive market conditions, we should see growth soon.

See all ideas
Summarizing what the indicators are suggesting.
Oscillators
Neutral
SellBuy
Strong sellStrong buy
Strong sellSellNeutralBuyStrong buy
Oscillators
Neutral
SellBuy
Strong sellStrong buy
Strong sellSellNeutralBuyStrong buy
Summary
Neutral
SellBuy
Strong sellStrong buy
Strong sellSellNeutralBuyStrong buy
Summary
Neutral
SellBuy
Strong sellStrong buy
Strong sellSellNeutralBuyStrong buy
Summary
Neutral
SellBuy
Strong sellStrong buy
Strong sellSellNeutralBuyStrong buy
Moving Averages
Neutral
SellBuy
Strong sellStrong buy
Strong sellSellNeutralBuyStrong buy
Moving Averages
Neutral
SellBuy
Strong sellStrong buy
Strong sellSellNeutralBuyStrong buy
Displays a symbol's price movements over previous years to identify recurring trends.