AMC Currently in Ignition phase -- Load the boat.Depending on how SPX continues, shorts may be stuck. Looking to load the boat if price holds above pink trendline and also the white 0.236 fib line.
AMC currently entering what I call it's ignition phase using the ol' snippy sniper on the 4 hour.
Trade ideas

joined ape army today! 🚀drop boost and follow for more! reasoning for my entry is simple, downtrend break/oversold RSI and perfect bounce from yellow support zone 🐒
I did take entry this morning and targeting 8.48-10.23-13.27, amc to the moon baby! ❤

AMC AnalysisPrice consolidated since my previous analysis. My expectations are unchanged. Price is currently mitigating the bullish POI at 6.59 and has taken liquidity at 5.96. I'm expecting price to make a bullish retracement into the bearish POI at 8.13 and continue lower.

AMC AnalysisPrice played out nicely last week according to my analysis. Price has taken the lows at 5.96 and reacted to the current bullish POI. Right now I'm expecting price to rally a little into the bearish POI at 8.13 and continue lower, following the order flow.

my parabolic senses are tingling 🙊🙈ape gang, last chart of the day from me! please drop boost and follow for more updates 💯
watching for break of 7/trend resistance, we break above these areas we may see some parabolic breakout action. Goodluck, see you soon 💛

AMC ready for a bounceWe have exited the descending triangle right into the lower support and buy back zone. Fundamentals are insane right now with synthetic shares etc, technicals look great. Accumulation/ Distribution, Stoch RSI, regular RSI all ready to coil back up. I have targets around $9.30, $11.30, could even see $15-16 . Not financial advice.

AMC | InformativeNYSE:AMC
we have two possibilities:
1- RSI is low, it's in oversold territory, and volume on the last session was more than average, so I expect a bounce up like a dead cat bounce for adjusting the indicators. If it breaks 21.07$, it can hit 23$ or 24$ as the target price.
2- It can continue bearish price action and hit the following support levels; this idea is valid if it loses 20.03$, then the next immediate targets are 17$ as minor support and 15$ as significant support,
I expect it hits 7$ eventually. But we will see. I flow with the market at the moment; there are many uncertainties.
*This is my idea and could be wrong 100%

SHORT | AMC | 50% more declineNYSE:AMC
Possible Scenario: SHORT
Evidence: Price Action, Recession
TP1: 2.60$
*I updated my price target like bank analysts, despite bank analysts I'm independent, and I don't get money from anyone for my analysis. My previous target price was 7$ when it was 20$. GL


AMC Bottom $ we going to visit an critical level for AMC which is our bottom price level above the 4.70$, where we should see a reversal , and huge buying pressure to test the our current resistant around the 5.90$.

Amc Haven’t checked the chart in a while. Personally I’m looking at 5.40 as a weekly support based off previous price action range. This could be a great long postion start up area. Really in this 5.40/5.66 range depending on your risk tolerance. Could still be a falling knife buy but that is a good zone from historical support range. Just my thoughts ideas and perspective. I have a few buys set in. Started a nibble at 5.76. Got a bid at 5.61 and 5.42. Good luck.

$AMC: Long Target 24.64$⚡Inverse Head & Shoulders Pattern forming?
⚡Neckline resistance 13.5$ Supported by Ichimoku Cloud resistance
⚡Bearish Divergence on the MFI, watch for a bounce at the 5.85$ area (huge liquidity zone)
⚡To confirm the Inverse Head & Shoulders Pattern a break of EMA 1 resistance is needed (8.6$ along with EMA 2 resistance, 10$)
⚡Strong VPVR resistance to the 12$ level
⚡Target of the Inverted Head & Shoulders i 24.64$ measured from the head to the top of the neckline
⚡Confirmation of this pattern is once the Ichimoku Cloud is broken forming a right shoulder (engulfing volume)
*WARNING* This thread is not financial advice. I am not a financial advisor.

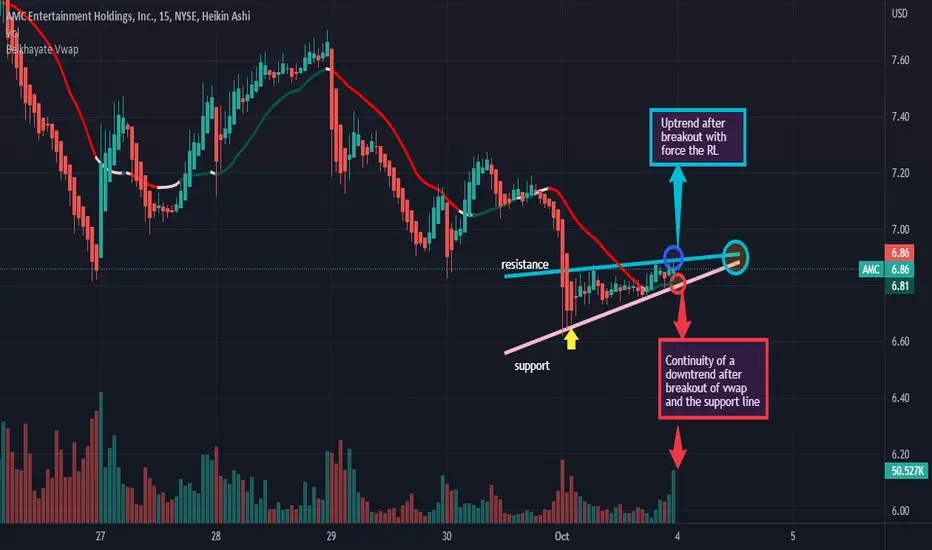
Analysis- Big probability of a DowntrendHi..As you see on the chart we will have a hight probability of a downtrend. But if the vwap indicator and the resistance line are broken it's mean that we will have a reversal trend.Thanks.

AMC AnalysisPrice is playing out as analyzed last week. I'm expecting price to go lower to take the lows at 5.96 after mitigating the current POI at 6.59, no changes to my previous expectations.

AMC downtrend H&S?Odd place for a H&S, but as far as the structure of the pattern its pretty textbook with a retest. The position of it is a little unusual to me.
Let me know what you think, and if you've ran into a H&S positioned this way.

AnalysisAs you see on the chart we will have a big probability of a continuity of a downtrend after the breakout with force the vwap indicator and the support. In other hand, we will have a reversal trend if the resistance line is broken with force by a big green candle with a large volume.Thanks.


AMC: Range trading! What if it breaks this congestion?• Since our last analysis, AMC has been just doing some range trading, trading above our support at $6.80, but below the 21 ema (the link to my last analysis is below this post);
• It seems we have another resistance to work with, the $7.89 (Sep 07 low, yesterday’s high). Along with the 21 ema, this creates a dual-resistance price area;
• AMC will only engage in a bullish momentum if it breaks this dual-resistance area, as long as it trades below it, nothing new will happen;
• In addition, the $6.80 is still our main support, and only if AMC loses it (and close below this point), we’ll see the continuation of the bearish sentiment, and the next target would be the $5.96;
• Either way, AMC looks interesting, but it must do a breakout from this congestion first;
I’ll keep you guys updated on this. Remember to follow me for more analysis like this! Keep in touch.

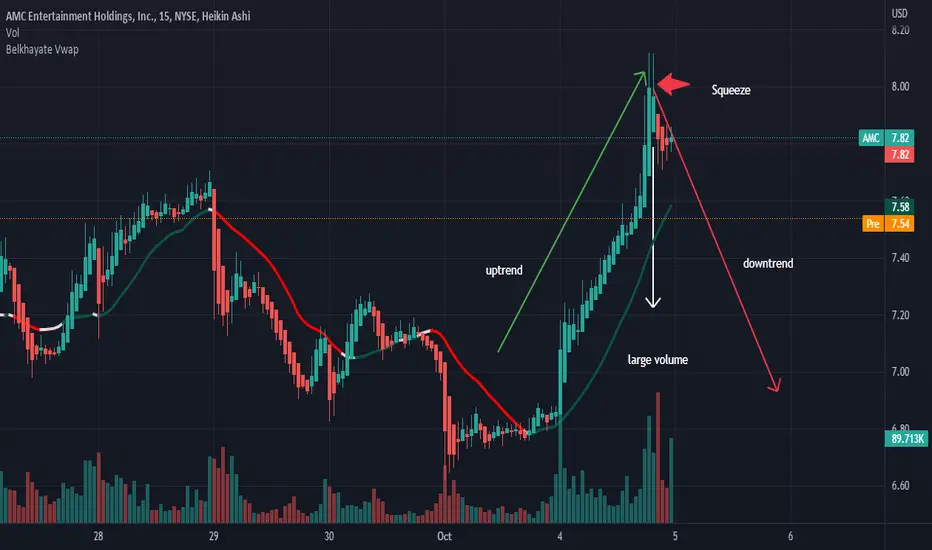
Analysis-Big probability of a downtrendHello everybody! How are you ? Good i hope! God bless!... Today on AMC as you see on the chart we will have a big probability of a downtrend.
Reminder: When we are in an uptrend and we see a candle with a long wick and also with a relatively small body accompanied by a large volume it means that we will have a high probability of having a downtrend. Sellers are trying to repel buyers.Thanks.
$AMC: Breakout?- VWAP Broken with engulfing volume.
- EMA resistance at 8,3$ (Daily close above = bull)
- EMA Resistance at 9.1$ (Daily close above = bull)
If 8.3$ gets rejected lower targets could occur.
*WARNING* This thread is not financial advice. I am not a financial advisor.

AMC: Above its support level again!• AMC looks quite resilient since our last analysis on it;
• Although it did a bottom sign last week, AMC couldn’t trigger the reversal pattern. However, the support level we mentioned at $6.80 is still working, as at any moment AMC closed a candlestick under this line;
• Since it is retesting this support for the second time, this could be a Double Bottom chart pattern;
• Either way, AMC must break the $7.89 in order to truly reverse, as this will frustrate the previous H&S chart pattern, and the target would be the previous top at the second shoulder, around $10.74;
• If AMC loses its support at $6.80 again, then it’ll probably seek the next support levels (red lines);
• Would be good to see the volume increasing to confirm any bullish reversal;
I’ll keep you guys updated on this. Remember to follow me for more analysis like this! Keep in touch.

Analysis-Big probability of an uptrendHello! On AMC as you see on the chart we will have a big probability of an uptrend after the breakout with force the resistance line by a big green candle with a large volume. In other hand we will have a continuity of a downtrend after the breakout of the vwap indicator and the support line. Thanks.