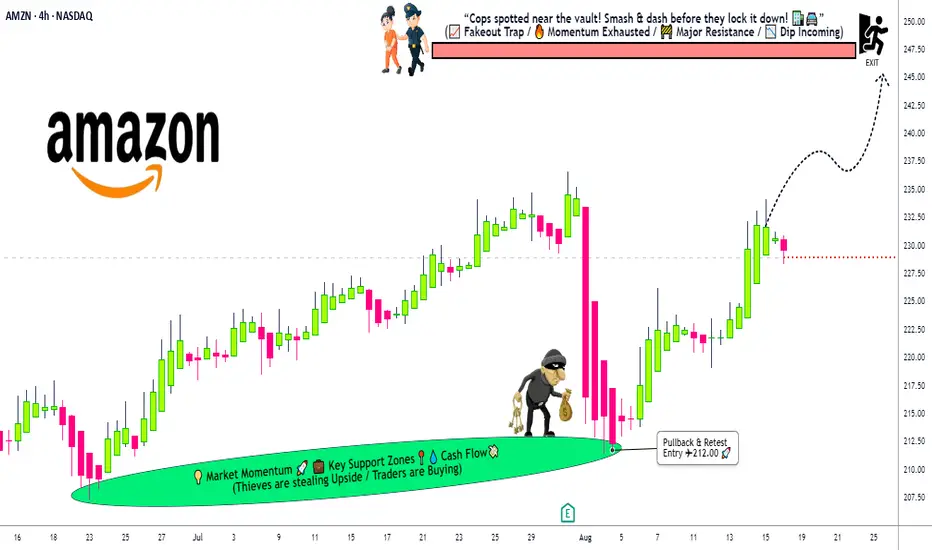
Amazon Stock Heist: Thieves Targeting 247 Escape Point🔐💰 AMAZON HEIST PLAN – STOCK MARKET ROBBERY STYLE 🚀📈
👋 Hey Thief OG’s, Money Grabbers & Market Shadows!
Today’s mission is inside the vault of Amazon.com Inc. (AMZN) – and we’re planning a Bullish Heist.
🎯 ENTRY – Layering the Break-In 💎
The vault doors are always open for the thief gang!
Place multiple Buy Limit Orders (layer entries) at 🏦:
230.00 / 227.00 / 225.00 / 222.00
You can add more layers to your heist plan based on your own risk appetite.
Thief strategy = stack the entries, wait for the pullback, strike big.
🛑 STOP LOSS – Thief Escape Route 🚔
This is the official Thief SL: @219.00.
But remember OG’s – adjust your SL based on your own strategy & bag size.
We don’t all run with the same loot.
🎯 TARGET – Police Barricade 🚨
Before the sirens ring, our escape bag is ready at @247.00.
That’s where we dump the loot and vanish into the shadows. 🏃💨💼
🕵️♂️ THIEF STYLE STRATEGY
✅ Layering entry method (multiple buy limits = thief stacking plan).
✅ Risk management = key to survival.
✅ Exit before the market police catches you.
💥 Remember OG’s: This is not financial advice – this is a robbery simulation in the stock market.
Support the gang 👉 Smash the Boost Button 💥 so our heist team gets stronger!
🤑💼💰 Every day, every chart, every loot = Thief Trader Style.
Stay sharp. Stay hidden. Stay profitable.
AMZN trade ideas
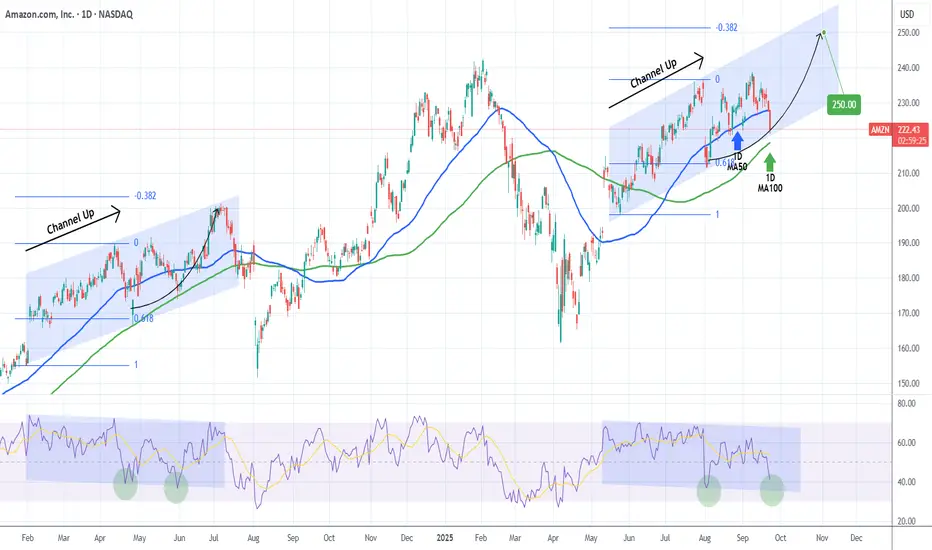
AMAZON Has it found a bottom?Amazon Inc. (AMZN) has been trading within a 4-month Channel Up and is currently pulling back on a Bearish Leg. The 1D MA100 (green trend-line) is just below and last time a similar Channel Up found support on it (May 31 2024), it rebounded for a -0.382 Fibonacci extension top.
As you can see, both patterns are identical, even making their first Higher Lows on their respective 0.618 Fib. Even their 1D RSI fractals are similar and right now we are headed of the 2nd Low (green circle).
As a result, we expect a bullish reversal there, targeting a little under $250 (Fib -0.382 ext).
-------------------------------------------------------------------------------
** Please LIKE 👍, FOLLOW ✅, SHARE 🙌 and COMMENT ✍ if you enjoy this idea! Also share your ideas and charts in the comments section below! This is best way to keep it relevant, support us, keep the content here free and allow the idea to reach as many people as possible. **
-------------------------------------------------------------------------------
💸💸💸💸💸💸
👇 👇 👇 👇 👇 👇
AMAZON FREE SIGNAL|SHORT|
✅AMZN Price rejects supply area with ICT displacement, showing bearish order flow. Liquidity below 217$ becomes the likely draw as inefficiency invites continuation.
—————————
Entry: 220.10$
Stop Loss: 222.00$
Take Profit: 217.00$
Time Frame: 2H
—————————
SHORT🔥
✅Like and subscribe to never miss a new idea!✅

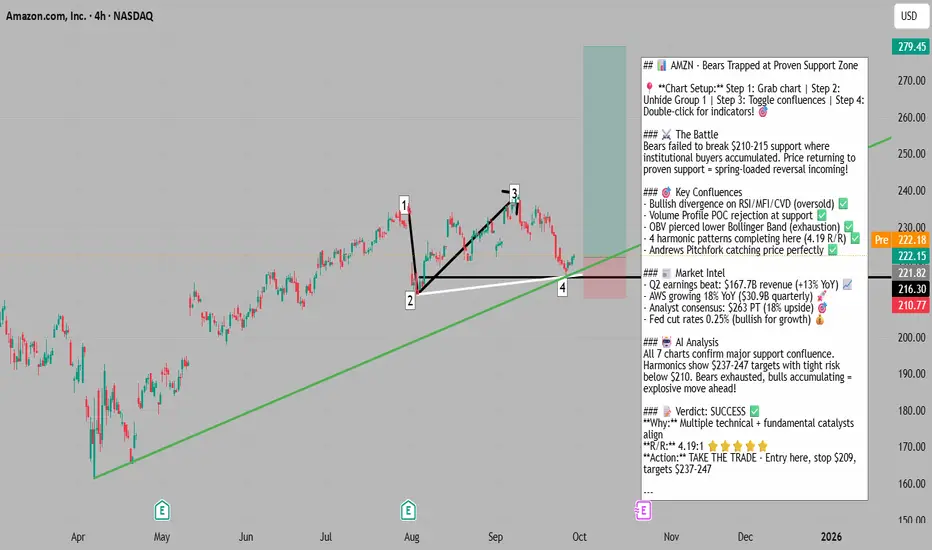
Bears Exhausted at Support - Spring-Loaded Reversal📍 To see my confluences and/or linework: Step 1: Grab chart 📊 Step 2: Unhide Group 1 in object tree 🌳 Step 3: Hide and unhide specific confluences one by one 🔍 Step 4: Double-click the screen to reveal RSI, MFI, CVD, and OBV indicators with divergence markings! 📈
🎯 AMZN: Bears Exhausted at Support - Spring-Loaded Reversal
The Market Participant Battle:
At point 2, bears attempted a major breakdown below the rising channel support, trying to trigger a cascade of stop losses and establish a new downtrend. However, bulls defended aggressively, creating a proven support zone. The move from point 2 to point 3 confirmed bulls' dominance, establishing this level as "proven buyers territory." Now at point 4, we're returning to this same proven support where institutional buyers previously showed their hand. Bears have exhausted their ammunition with multiple failed attempts to break lower, setting up a powerful reversal as price returns to where the smart money accumulated.
Confluences:
Confluence 1: Bullish Divergence Convergence 🔥
At point 4, we have a spectacular bullish divergence setup across multiple indicators. While price made a higher low, RSI, MFI, and CVD candles all printed lower lows - a classic sign of bearish exhaustion. This divergence indicates selling pressure is weakening despite price holding higher, suggesting accumulation is occurring beneath the surface. Both RSI and MFI are in oversold territory, providing the fuel for an explosive move higher.
Confluence 2: Volume Profile POC Rejection 📊
The volume profile from points 1 to 2 shows the Point of Control (highest volume node) sitting exactly at point 2. Price has now returned to test the Value Area High and was immediately rejected upward. This demonstrates that the majority of trading volume occurred at these levels, creating a massive support zone where institutional buyers are defending their positions.
Confluence 3: OBV Bollinger Band Pierce 💪
At point 4, On-Balance Volume pierced below its lower Bollinger Band - a rare occurrence that historically precedes sharp reversals. This suggests that despite the price decline, actual selling volume is reaching exhaustion levels. The OBV divergence confirms accumulation is happening while weak hands are being shaken out.
Confluence 4: VWAP Deviation Trap 🎯
At point 2, price dipped below the first VWAP standard deviation, failed to reach the second deviation (showing limited selling momentum), then aggressively closed back above the first deviation. This trapped bears who were betting on continued downside and created a liquidity vacuum above as shorts scrambled to cover.
Confluence 5: Andrews Pitchfork Precision 📐
The Andrews Pitchfork catches point 4 with surgical precision at its lower median line. This technical tool, favored by institutional traders, provides a mathematical framework showing we're at the extreme lower boundary of the current trend channel. The bounce from this level confirms its significance.
Confluence 6: Harmonic Pattern Convergence 🦋
We have four harmonic patterns all completing at the current level: a Butterfly, Cypher, Bat, and Anti-Cypher. This rare convergence creates a powerful confluence zone. The Butterfly pattern shows a 20.88% profit potential with a 4.19 risk/reward ratio. Multiple harmonic completions at one price level indicate a high-probability reversal zone.
Web Research Findings:
- Technical Analysis: Current RSI at 39.13 indicates neutral conditions with MACD at -0.50 suggesting a buy signal. Multiple moving averages are converging near current levels creating a support cluster.
- Recent News/Earnings: Q2 2025 earnings exceeded expectations with $167.7B revenue (vs $162.09B expected) and $1.68 EPS (vs $1.33 expected). AWS revenue grew 18% YoY to $30.87B.
- Analyst Sentiment: 45 analysts maintain "Strong Buy" consensus with average price target of $262.98, representing 18.37% upside. Recent upgrades from major firms with targets ranging from $230 to $305.
- Data Releases & Economic Calendar: Next earnings expected October 27-31, 2025. Company has beaten EPS estimates 100% of the time in past 12 months.
- Interest Rate Impact: Fed cut rates by 0.25% in September to 4.00%-4.25% range, with two more cuts expected in 2025. Lower rates support growth stock valuations and reduce AWS customers' financing costs.
Layman's Summary:
Think of this trade like a compressed spring. Bears pushed the stock down hard multiple times but couldn't break the floor at $210-215. Each failed attempt made them weaker while bulls quietly accumulated shares. The technical indicators are screaming "oversold" while big institutions are raising their price targets. With the Fed cutting rates (making money cheaper to borrow) and Amazon's cloud business growing strongly, the stock is coiled for a bounce. It's like watching a basketball being pushed underwater - the harder you push, the more violent the bounce when you let go.
Machine Derived Information:
- Image 1 (4H Chart): Rising channel with numbered pivot points - Significance: Shows clear support at point 2 with successful retest at point 4 - AGREES ✔
- Image 2 (4H Duplicate): Confirms first image setup - Significance: Reinforces support zone validity - AGREES ✔
- Image 3 (4H Pitch Fork): Multiple overlapping trendlines converging at current price - Significance: Creates strong magnetic price level - AGREES ✔
- Image 4 (4H Zone): Green and red zones marking supply/demand areas - Significance: Currently at demand zone bottom - AGREES ✔
- Image 5 (4H Channel): Ascending channel with clear boundaries - Significance: Price at lower channel support - AGREES ✔
- Image 6 (4H Horizontal): Key horizontal support at point 2 - Significance: Major support successfully defended - AGREES ✔
- Image 7 (4H Harmonics): Four harmonic patterns completing - Significance: High-probability reversal zone with 4.19 R/R - AGREES ✔
Actionable Machine Summary:
All seven chart images unanimously confirm we're at a critical support level with multiple technical factors aligning for a reversal. The combination of horizontal support, channel support, harmonic pattern completions, and oversold indicators with bullish divergences creates an extremely high-probability long setup. Risk is clearly defined below $210 with targets at $237-$247 based on harmonic projections and analyst consensus.
Conclusion:
Trade Prediction: SUCCESS ✅
Confidence: High
This setup presents a textbook accumulation pattern where smart money has established a floor and retail bears are exhausted. The confluence of bullish divergences, volume profile support, harmonic completions, and fundamental tailwinds from AWS growth and Fed rate cuts creates an asymmetric risk/reward opportunity. Entry at current levels with stops below $210 offers 4:1 reward potential to initial targets.
AMAZON STOCKS AMAZON stocks pulled out of trend and picked liquidity and back on bullish path, the key drivers for the uptrend will be the following investment into critical infrastructure its building with a strong diversified portfolio in the following
Amazon Web Services (AWS) Growth:
AWS remains Amazon’s largest and most profitable division, generating over $30 billion in quarterly revenue. Demand for cloud infrastructure, especially driven by artificial intelligence workloads and enterprise digital transformation, is fueling AWS growth. AWS’s market share is around 31%, making it the global leader, and new initiatives like AI chatbot Nova add to future growth potential.
Advertising Revenue Expansion:
Amazon’s advertising business is rapidly growing, reaching $15.7 billion in revenue in Q2 2025, up 22% year-over-year. Its robust platform, spanning e-commerce, Prime Video, Twitch, and partnerships with Roku and Disney, positions Amazon as a major digital advertising player.
Innovation in Robotics and Logistics:
Investments in robotics and warehouse automation, including deploying over one million robots and launching same-day grocery delivery, are improving operational efficiency, reducing costs, and supporting faster delivery. These innovations enhance Amazon’s competitive moat.
E-commerce and Fresh Grocery Expansion:
Amazon's push into fresh grocery and same-day delivery strengthens its retail presence against competitors like Walmart and Instacart, capturing growing consumer demand for convenience.
Profitability and Margin Improvement:
The company is showing rising operating income and improved profit margins in both North American and international operations due to operational efficiencies and disciplined cost management.
International Expansion:
Emerging markets present opportunities to increase digital retail penetration, expand Prime subscriptions, and grow AWS adoption.
AI Integration and Products: Ongoing AI integrations across AWS, e-commerce, and devices (e.g., Alexa+) drive innovation and customer engagement.
Strategic Partnerships: Collaborations with Disney, Roku, and others in advertising and streaming enhance ecosystem stickiness and revenue diversity.
Large Market Cap and Financial Health: With a market cap around $2.5 trillion and strong cash flow generation, Amazon has robust resources to invest in growth.
Potential New Market Entrants: Entry into new markets through acquisitions or innovations could unlock further upside.
Amazon is doubling down on AI investments, especially through its cloud computing arm AWS, to develop generative AI capabilities.
The company has invested billions in AI startups like Anthropic (over $8 billion), aiming to strengthen AI collaborations and embed AI-powered products across Amazon services.
Top Companies and Shareholders Holding Amazon Shares in 2025
Jeff Bezos (Founder and Executive Chairman): Owns around 883 million shares (about 8.3% of the company). Despite recent sales of some shares, Bezos remains the largest individual shareholder with a stake valued at approximately $197 billion.
Andrew Jassy (CEO): Holds about 2.2 million shares (a small fraction but significant insider holding), representing his commitment and confidence in the company.
Major Institutional Investors and Asset Managers:
The Vanguard Group: Holds approximately 7.4% of Amazon’s shares, making it one of the largest institutional investors by assets under management.
BlackRock, Inc.: Owns about 6.1% of the outstanding shares and is another top institutional holder globally.
State Street Corporation: A major institutional investor with multi-billion-dollar holdings.
Fidelity Investments: Another top holder known for active management and long-term investments.
Geode Capital Management: Significant institutional stake, often involved in indexing and fund management.
Top Hedge Funds Holding Amazon:
Coatue Management
Adage Capital Management
Tiger Global Management
Skye Global Management
Two Sigma Investments
Major Companies Owned by Amazon
Whole Foods Market: A leading organic grocery chain, acquired in 2017, expanding Amazon's footprint in physical retail and groceries.
Zappos: An online shoe and clothing retailer known for exceptional customer service, acquired in 2009.
Twitch: The popular live streaming platform, especially for gamers and e-sports, acquired in 2014.
IMDb: The Internet Movie Database, an online repository for films, TV shows, and celebrity information, acquired in 1998.
PillPack: An online pharmacy that offers sorted medication delivery, acquired in 2018, marking Amazon's entrance into healthcare.
Goodreads: A social platform for book lovers to review and discuss literature, acquired in 2013.
Souq.com: A major e-commerce platform in the Middle East, acquired in 2017 to strengthen Amazon’s presence in that region.
Ring: Manufacturer of smart doorbells and security cameras, acquired in 2018, integrated with Amazon's home device ecosystem.
ComiXology: A digital platform for comics and graphic novels, acquired in 2014.
Woot: An online deals retailer known for daily limited-time offers, acquired in 2010.
MGM (Metro-Goldwyn-Mayer): Acquired in 2021, MGM is a legendary film and TV studio that bolsters Amazon Prime Video’s content library.
Kuiper Systems: Amazon’s ambitious satellite internet project aimed at providing global broadband connectivity.
Amazon's Subsidiaries also include:
Amazon Web Services (AWS): The highly profitable cloud computing division offering infrastructure, software, and AI services.
Amazon Robotics: Specializing in warehouse automation and robotics technology.
Amazon Fresh and Amazon Go: Physical grocery and convenience stores specializing in fresh food and cashier-less shopping experiences.
Zoox: An autonomous vehicle startup acquired to develop self-driving car technologies.
This extensive network of companies helps Amazon diversify revenue streams, expand ecosystem lock-in, and innovate across multiple sectors.
Wall Street analysts remain bullish on Amazon, with many maintaining a "Strong Buy" rating based on these catalysts.
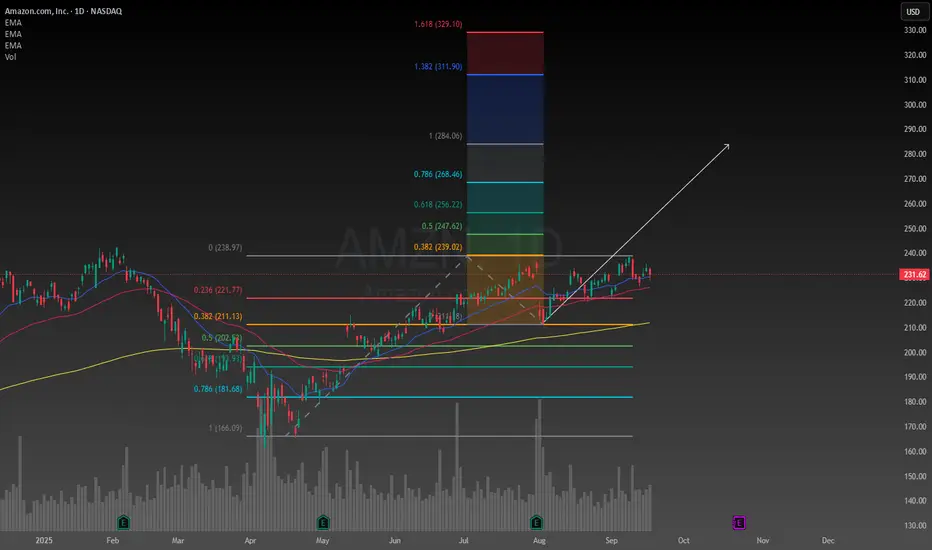
NOTE;218.52 BUY POSITION IS GOOD AND TARGET WILL BE 283.74.
#AMAZON #STOCKS

AMZN: Looking HOT!Watching the reactions to the zone. I will innit ate the position if we land on the support or if my AI system gives me an entry.

Amazon Building Launch Pad - ABC Flat Appears as if this is forming a perfect ABC Flat correction, however tis market is so bull it may start next week from this price, if we can get some seasonal weakness in October hoping it fills the GAP. Leg into longs if it continues to decline.
But interestingly enough, what I have found in the past , is that the stock seems to be weak in the 4th quarter, which seems contrary to the fact that it does so much retail business in those months, and actually bulls hard in 1st quarter. So i think its worth watching to see what happens this time around.

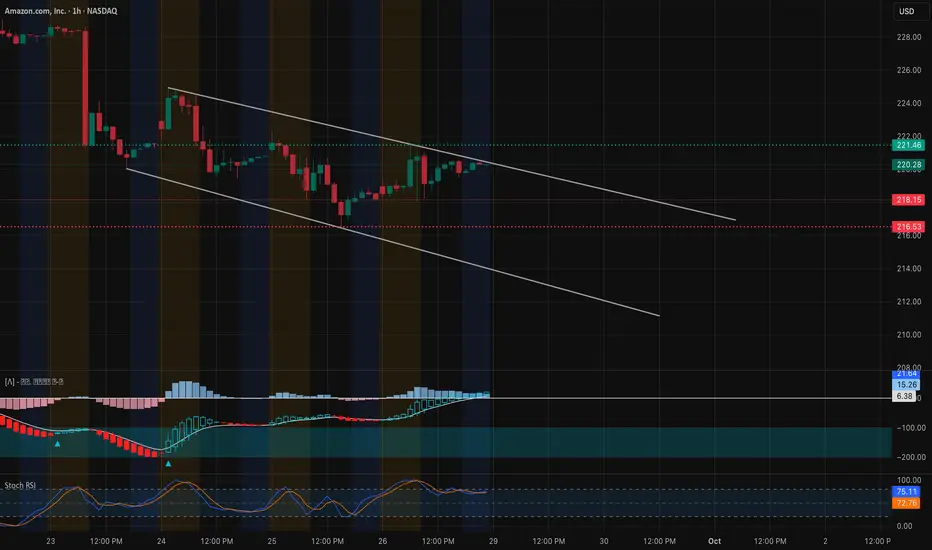
AMZN – Coiling Snap Back as Gamma Signals Set the Range Sep 291-Hour Technical Outlook
Amazon is still moving inside a descending channel that’s been intact for over a week. Price has been repeatedly testing the $217.5–$218 support while carving out slightly higher lows—early signs of a basing attempt. Current price near $220 is rubbing against the channel’s downtrend line. MACD histogram is building positively and Stoch RSI is holding in bullish territory, hinting at upside momentum if buyers press through resistance.
Key upside levels are $221.5 and $222.5, followed by the major swing zone at $227.5–$230. Support rests at $218.1, then $216.5, where a decisive break could open a retest of the recent lows near $215.
Gamma Exposure (GEX) Confirmation:
Options positioning strengthens the map:
* Highest positive GEX / Call Resistance sits at $225, aligning with the top of the recent structure.
* A dense second call wall clusters at $222.5, which explains why price has stalled there.
* On the downside, dealers show heavy put support at $217.5 and $215, matching the key channel floor.
If AMZN can close above $222.5 with volume, gamma hedging could fuel a quick push to $227.5–$230. A sustained drop through $216.5 would likely bring dealer-driven pressure to $215.
Trade Ideas & Option Plays for This Week
* Bullish Play: Enter on an hourly close above $222.5, targeting $227.5–$230. Options: 1-week 222.5 calls or a 222.5/227.5 call debit spread for lower risk.
* Bearish Play: Short below $216.5, targeting $215 and possibly $212.5. Consider short-dated puts or 217.5/212.5 put spreads.
* IVR around 27.9 and IVx avg near 34 means premiums are moderate—good for defined-risk spreads.
My Take
AMZN is setting up for a clean range expansion. A decisive breakout above $222.5 would turn the short-term tide bullish with room to $230. But if $216.5 cracks, sellers could quickly push to the $215 zone. Watch the open and first hour closely—gamma levels and volume will tell the story.
Disclaimer: This analysis is for educational purposes only and does not constitute financial advice. Always do your own research and manage risk before trading.
AMAZON ARE WE HEADING TO $258 ? HERE IS THE FULL ANALYSIS Hi Trading fam
So we have Amazon and based on what we are seeing we see two scenarios playing out:
Bullish:
If we can break and hold above 219 then we can see levels of : 235,241,and 258 being hit
Bearish:
If break the low of 210 then we hit 207,204, 199, 190 and then 185
Trade Smarter Live Better
Kris
AMZN Oct. 1 – Testing $220 Pivot, Which Side Breaks First?Intraday View (15-Min Chart)
AMZN sold off sharply and is now consolidating under a descending trendline near $219. Momentum remains bearish, but support around $218–$219 is trying to hold.
* Support Levels: $218.95, $217.93, $216.48
* Resistance Levels: $220.20, $222.54, $224.81
* Indicators: MACD still red, showing sellers in control. Stoch RSI sitting mid-low, giving room for a possible bounce.
📌 Intraday Thought (Oct. 1): If $219 holds, AMZN could rebound toward $222–$224. A breakdown under $218 risks a slide toward $216. Scalpers can lean long near $219 support with tight stops, or fade into $222.5 resistance if tested and rejected.
Options & Swing View (1H + GEX)
Gamma exposure sets clear levels:
* Upside: Call walls stacked at $222.5–$227.5, with gamma extensions toward $230–$235.
* Downside: Heavy put support at $217.5–$215, with deeper walls at $212.5.
This leaves AMZN boxed between $217.5–$222.5 short term. A breakout over $222.5 could target $227–$230, while losing $217.5 risks continuation into $215 or lower.
* Bullish Play (Oct. 1): Calls or spreads targeting $227–$230 if $222.5 breaks.
* Bearish Hedge: Puts targeting $217.5 → $215 if $218 fails.
* Neutral Play: Iron condor between $217.5–$222.5 while AMZN remains pinned.
My Thoughts (Oct. 1)
AMZN is in a tight coil around $219, with $222 overhead and $217.5 below as key decision levels. A confirmed break of either side should dictate the next swing move. I’d stay cautious intraday until one of those levels clears, then align options with the breakout direction.
Disclaimer: This analysis is for educational purposes only and does not constitute financial advice. Always do your own research and manage risk before trading.

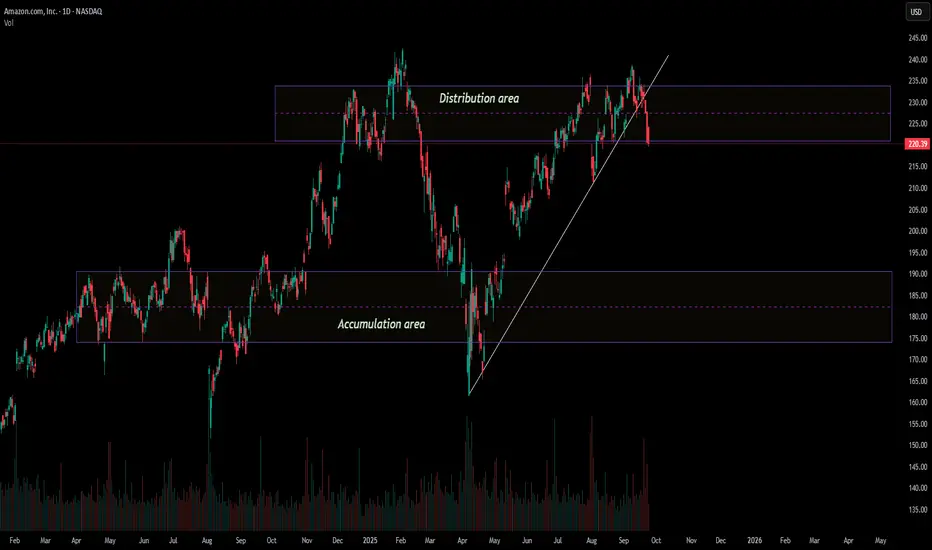
Amazon analysisRight now, I believe price is trading inside the distribution area that I’ve highlighted.
The recent break of the trendline suggests momentum may be shifting, with the risk of a reversal into a downtrend.
From an investor’s perspective, this is not the most attractive area to be buying. A more favorable entry could come if price moves back down into the accumulation area I’ve marked on the chart.
🎯 Conclusion: My view is cautious — I think AMZN may leave the distribution phase and head lower toward the accumulation area. As an investor, patience here may prove wiser than chasing current levels.
The #1 Chart Pattern:Ascending Triangle - Amazon StockMan am doing my research
and did you know
that you can start a business
using your trading
skills?
This is mind blowing to me
i didn't think a skill
like trading can actually
be a full time
professional career.
So here i am banging my
head against the wall
thinking trading is a hustlers game
with no professional career
at the end of the tunnel.
But this thought is so false.Guys
trading is a real business
infact its the highest
form of business out here.
If you take this thing serious it can lead
to your financial freedom.
Because of this am going to have
a professional trading career
in the future you guys.
I didn't know that it gets this huge.
Am so humbled by this.
The fact that the government
recognises trading as a skill
has really humbled me
And now am starting to
appreciate people
like Robert Kiyosaki.
Who keep encouraging
young people to take up
financial education and change
their lives.
My life has changed or at least
my mindset has seen beyond
what my poor brain could imagine
man.
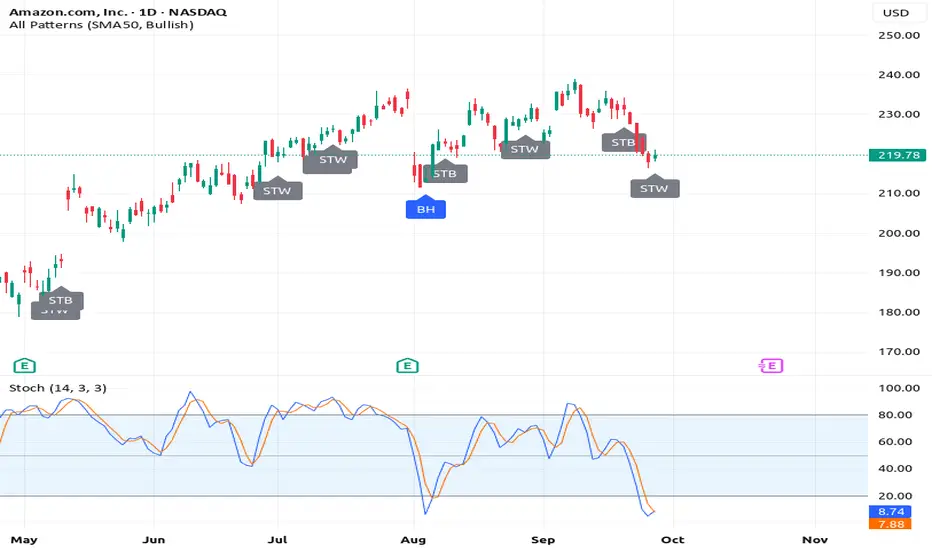
Anyway look at this chart. NASDAQ:AMZN
Look at the stochastic..(14,3,3)
When that blue line crosses above
the orange line
It will signal an entry signal.
But dont be excited and
expect the price to jump
up immediately.
The pattern is called "Ascending triangle"
This means the price will bounce off the resistance.
before it breakouts out..
That bounce from resistance will form
higher lows which get closer to
the breakout point.
The Spinning Top White Is
The Candlestick charting
technique am using here
Which i learnt from
reading Steve Nison's Book
On Japanese
Charting Techniques,
second edition.
Rocket boost this content to learn more.
Disclaimer: Trading is risky
please risk management
and profit taking strategies.
Also feel free to use a
simulation trading account.
Also dont trade Zero day
options that expire in one day,
please take this as a serious warning.
Amazon Can Stabilze Near $210Amazon has been pulling back lately, and I’ve been tracking this as a potential wave four flat correction, with wave A and wave B already completed and wave C now eyeing the support around 210. That zone also lines up with the 0.382 Fibonacci retracement and previous breakout levels, so it could attract buyers and provide stabilization. The retracement is quite deep at around 12 percent, but since the stock has not yet retested February highs, it looks more like a consolidation, a pause rather than a new bearish trend. I assume there is a chance for a nice bounce into wave five, still this year.
GH

Amazon (AMZN) shares fall around 3% in a single dayAmazon (AMZN) shares fall around 3% in a single day
As the chart shows, Amazon (AMZN) shares fell by roughly 3% yesterday after reports that the US Federal Trade Commission has launched a probe into the company over alleged “dark patterns”.
According to the allegations, Amazon may have deliberately complicated the process of cancelling Prime subscriptions in order to retain customers. Should the charges be proven, this could result in significant fines and have a major impact on one of Amazon’s key revenue streams.
Amazon’s share price dipped below $220 yesterday for the first time since 12 August. Could the decline continue?
Technical analysis of Amazon (AMZN) chart
In our 5 September analysis, we:
→ used AMZN stock price swings to plot an ascending channel (shown in blue);
→ suggested the price could extend its bullish structure after breaking through resistance R (shown in red).
Indeed, in the following days there was some bullish momentum: peak B was higher than peak A. However, this appears more a sign of weakness when judged by the nature of the reversal:
→ on 10 September, the price edged only slightly above the summer peak,
→ before tumbling sharply, with bearish candles widening.
This move, showing clear signs of a Double Top pattern (A–B), may suggest that buyers at September’s high were trapped, with stop-loss closures adding to the downward pressure.
The previously plotted ascending channel remains valid, but Amazon stock price has dropped (shown by the red arrow) into its lower half. In this context, the channel’s midline and the $227.70 level could now act as resistance.
Bulls, however, still have grounds to expect support from:
→ the bullish reversal zone formed in early August, when a narrowing triangle appeared on the chart with its axis around $215;
→ the QL line, which divides the lower half of the channel into quarters.
Although the negative sentiment from FTC-related news may eventually fade, what remains concerning is AMZN’s relatively weaker performance in 2025 compared with the broader market: while the S&P 500 set a fresh all-time high this week, Amazon shares have barely moved since the start of the year.
This article represents the opinion of the Companies operating under the FXOpen brand only. It is not to be construed as an offer, solicitation, or recommendation with respect to products and services provided by the Companies operating under the FXOpen brand, nor is it to be considered financial advice.

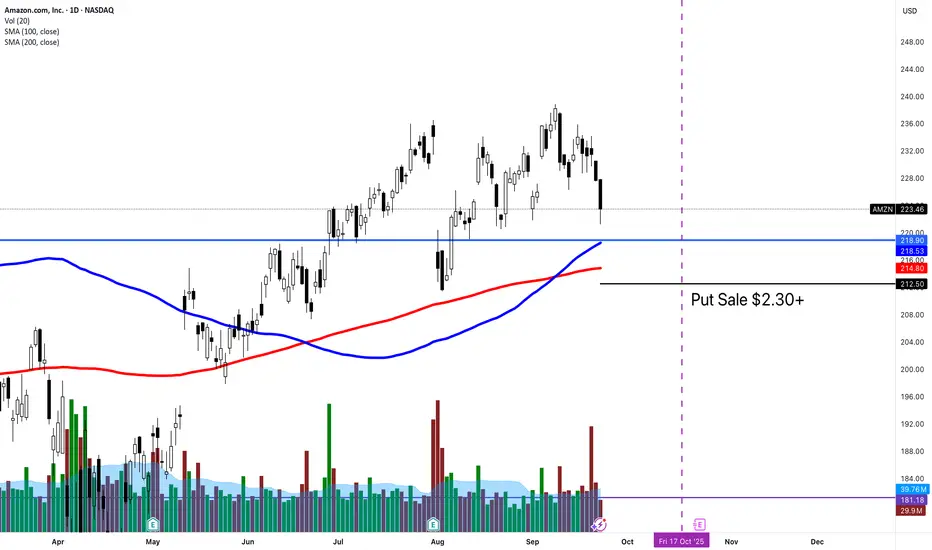
AMZN put sale Put sale is below the 100/200 SMA.
Before earnings. 1%+ premium capture. Who is afraid to own AMZN? Not me.
Buy low, sell high. 5 down candles in a row.
Introduction to Commodity Supercycle1. Understanding Commodities
Commodities are basic goods used in commerce that are interchangeable with other goods of the same type. They serve as the foundation of the global economy and are divided into several categories:
Energy commodities – oil, natural gas, coal
Metals – gold, silver, copper, aluminum
Agricultural commodities – wheat, corn, soybeans, coffee
Livestock – cattle, pork, poultry
Commodities are distinguished from manufactured products by their standardization and global demand. A barrel of crude oil, for example, is fundamentally the same regardless of producer, allowing it to be traded globally.
2. What is a Commodity Supercycle?
A commodity supercycle refers to an extended period, often lasting 10–30 years, during which commodity prices trend above their long-term average due to structural changes in global demand and supply. Unlike regular commodity cycles, which are typically shorter (3–5 years), supercycles are driven by macroeconomic forces rather than temporary market fluctuations.
Key characteristics of a commodity supercycle include:
Prolonged high prices – commodity prices remain above historical averages for extended periods.
Global demand drivers – typically fueled by emerging markets’ industrialization and urbanization.
Supply constraints – limited capacity to quickly increase production.
Inflationary pressures – rising commodity prices impact broader inflation trends.
Investment opportunities – commodities and related assets tend to outperform other asset classes.
3. Historical Perspective of Commodity Supercycles
Commodity supercycles are not a new phenomenon. Historical analysis highlights several key supercycles:
3.1 The 19th Century Industrialization Cycle
The first recognized supercycle emerged during the Industrial Revolution. Demand for coal, iron, and other raw materials surged as Western Europe and North America industrialized. Key drivers included mechanization, railway construction, and urbanization.
3.2 Post-World War II Reconstruction
Following WWII, Europe and Japan required massive reconstruction. Commodity demand, especially for steel, copper, and oil, rose sharply. This period also saw significant government investment in infrastructure, creating long-term demand pressures.
3.3 The 2000s China-Led Supercycle
The most cited modern supercycle was driven by China’s industrial boom. Rapid urbanization, construction, and manufacturing required unprecedented volumes of metals, energy, and agricultural products. During this period:
Copper prices increased fivefold between 2003 and 2007.
Iron ore prices surged over 400% between 2003 and 2008.
Oil prices reached historic highs, peaking above $140 per barrel in 2008.
This supercycle illustrates the impact of a single economy’s rapid growth on global commodity markets.
4. Drivers of Commodity Supercycles
Several structural and cyclical factors contribute to the formation of supercycles:
4.1 Economic Growth in Emerging Markets
Emerging economies, particularly China, India, and Brazil, experience rapid urbanization and industrialization. Their growing demand for raw materials drives prices upward globally.
4.2 Population Growth and Urbanization
Increasing population, especially in developing countries, creates long-term demand for energy, food, and construction materials. Urban infrastructure, housing, and transportation projects amplify this effect.
4.3 Technological Advancement and Industrialization
While technology can sometimes reduce demand through efficiency gains, large-scale industrialization typically increases the need for steel, copper, and energy-intensive resources.
4.4 Supply Constraints
Unlike demand, which can surge quickly, commodity supply often lags due to:
Long lead times for mining and energy projects
Geopolitical risks in resource-rich regions
Environmental regulations limiting extraction
This imbalance between rising demand and constrained supply sustains higher prices.
4.5 Inflation and Monetary Policy
Periods of loose monetary policy and low real interest rates often coincide with commodity supercycles. Investors seek inflation hedges, and commodities become attractive, creating a self-reinforcing cycle.
5. Key Commodities in Supercycles
Certain commodities are more prone to supercycle effects due to their strategic importance:
5.1 Energy Commodities
Crude Oil: Critical for transportation and industrial production.
Natural Gas: Heating, power generation, and chemical feedstock.
Coal: Industrial power, especially in emerging markets.
Energy demand rises with urbanization, industrialization, and global transport expansion, often driving supercycle trends.
5.2 Metals
Copper: Integral for electrical systems, construction, and electronics.
Iron Ore & Steel: Essential for infrastructure and heavy industry.
Aluminum & Nickel: Key for manufacturing, transportation, and battery production.
Technological advances like electrification and renewable energy further boost demand for certain metals.
5.3 Agricultural Commodities
Grains (wheat, corn, rice): Food security concerns, population growth.
Soybeans & Edible Oils: Rising protein consumption and industrial applications.
Coffee & Sugar: Urban lifestyle changes and consumer demand.
Weather patterns, climate change, and land scarcity can intensify supply constraints.
6. Investment Implications of Commodity Supercycles
Commodity supercycles create both opportunities and risks for investors:
6.1 Asset Classes Benefiting
Commodity Futures and ETFs: Direct exposure to price increases.
Mining and Energy Stocks: Profit from rising commodity prices.
Infrastructure Investments: Higher raw material demand can boost certain industries.
6.2 Risks
Volatility: Despite long-term trends, commodities remain cyclical in the short term.
Inflation and Currency Risk: Commodities often trade in USD, affecting returns for other currencies.
Geopolitical Events: Resource nationalism, wars, and trade restrictions can impact supply.
6.3 Strategic Positioning
Long-term investors often diversify across commodities and related equities to capture supercycle gains while mitigating risk.
7. Measuring and Identifying Supercycles
Economists and market analysts use several tools to identify supercycles:
7.1 Real Price Trends
Adjusting for inflation, analysts track long-term price trends to distinguish supercycles from temporary spikes.
7.2 Supply-Demand Gaps
Persistent supply shortages relative to rising demand indicate potential supercycle formation.
7.3 Macro Indicators
Urbanization rates
Industrial production growth
Energy consumption patterns
These indicators signal structural demand trends that can drive supercycles.
7.4 Investment Flows
Tracking institutional investment in commodities can reveal market expectations of long-term price growth.
8. The Role of Emerging Technologies
Emerging technologies can both create and sustain supercycles:
Electric Vehicles (EVs): Surge in copper, lithium, nickel, and cobalt demand.
Renewable Energy Infrastructure: Increases need for steel, aluminum, and rare earth metals.
Smart Agriculture: Efficient production can ease pressure on food commodities but also raises demand for fertilizers and energy.
Technology-driven demand tends to be structural and long-lasting, aligning with supercycle characteristics.
9. Environmental and Geopolitical Considerations
9.1 Climate Change
Extreme weather affects crop yields and energy supply.
Stricter environmental regulations may restrict mining, oil drilling, and fossil fuel production.
9.2 Geopolitical Risks
Resource-rich countries may leverage commodities for political influence.
Trade wars and sanctions can disrupt supply chains, further impacting prices.
10. Future Outlook
Many analysts believe a new commodity supercycle may be emerging due to:
Post-pandemic industrial recovery
Rapid energy transition to renewables
EV and battery metal demand
Geopolitical shifts and supply chain restructuring
However, global economic slowdowns, technological breakthroughs, and policy interventions could temper or extend the supercycle’s trajectory.
Conclusion
Commodity supercycles represent one of the most significant long-term economic phenomena affecting markets, investors, and nations. Driven by structural demand growth, supply constraints, and technological innovation, they influence global trade, inflation, and investment strategies. Recognizing the signals of a supercycle allows governments, corporations, and investors to strategically position themselves to benefit from prolonged commodity trends. While predicting the exact duration and magnitude is challenging, historical patterns provide valuable guidance for navigating future supercycles.
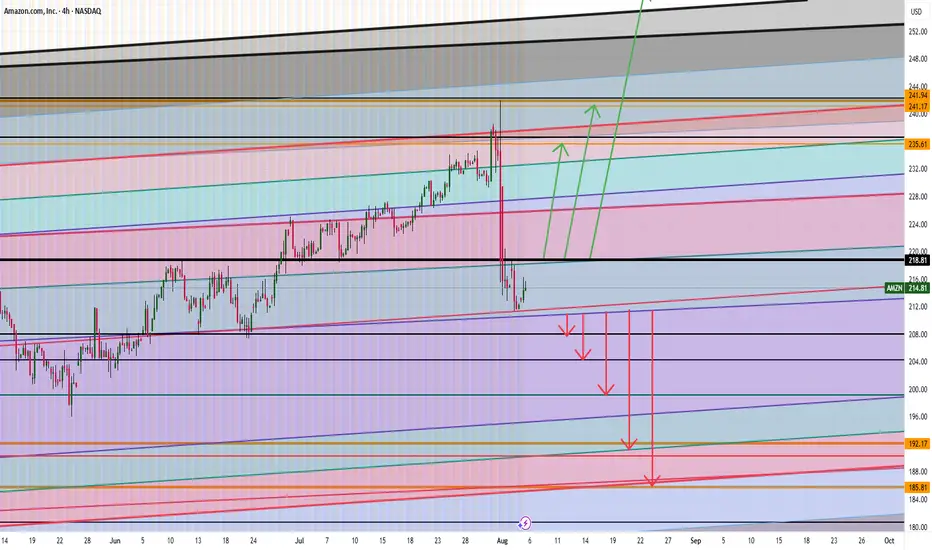
AMZN SHORTAMZN Sitting on a Cliff…
Amazon’s hanging out right on a key trendline around $220. If it holds, cool maybe we bounce. But if it breaks… could get ugly.
Price is testing support from the March uptrend.
Not much volume below = could drop fast if it slips.
Big support zone around $187–$184 (Fib levels).
aggressive selling Volume’s been picking up lately — people are watching.
What I’m Watching:
Lose 220, we get $190 → $185

AMZN Sep 23 – Bears Drive the Tape, Eyes on 227 SupportPrice Action & Setup (1-Hour Chart)
Amazon slid hard today, breaking a string of higher lows and printing a clear lower-high, lower-low sequence. Price is sitting right at 228 support after a steady fade from the 235 area. This is now the pivot to watch. A clean hourly close below 227.5 opens the door toward 225 and possibly 222.
Momentum Read
MACD is firmly negative and widening, which confirms downside pressure. Stoch RSI is buried near oversold territory, hinting that any bounce is likely to be more of a dead-cat reaction unless momentum sharply shifts.
GEX (Options Flow) Confluence
Gamma exposure lines up with the bearish chart:
* Highest positive GEX / Call resistance: around 232.5 and 237.5
* Big Call Walls: 237.5 and 242.5 — strong upside caps if AMZN tries to rebound
* Heavy Put Walls: 228 (major support), 225, 222 (next magnets)
A decisive break under 227.5 could trigger dealer hedging to the downside, intensifying the move to 225 and even 222.
Trading Plan
* Short setup: Look for a clean hourly break under 227.5 with volume. First target 225, stretch target 222. Tight stop above 230.
* Bounce scalp: Only if price reclaims 230 with conviction; target 232.5–235, but treat it as a counter-trend trade.
Option Angle
Puts around 225 or 222 strikes can work for short-dated bearish plays if breakdown confirms. Call buyers should stay cautious until a firm reversal above 232.5 materializes.
Bottom Line
Trend bias is down. Losing 227.5 sets a clean path toward 225–222. A surprise reclaim of 230 would be the first sign bears are losing grip.
Disclaimer: This is for educational discussion only and not financial advice. Always do your own research and manage risk.

Short AMZN finished with pinbar candleThe market is in position for a correction.
There is a similar pinbar pattern on the weekly, like the previous drop.
Expecting a drop in AMZN to materialize.
Look at the daily, there was a gap down on earnings, a warning of what is coming ahead.
If long, we would expect after the gap close, to continue higher, especially after Fed announcement about the interest rate.
Since it did not materialize to the long side, then the hypothesis of long, is now invalid.
Hence, the hypothesis of short, is more likely.

Emerging Market Impact1. Defining Emerging Markets
The term “emerging markets” (EMs) was first coined in the 1980s by Antoine van Agtmael of the International Finance Corporation to describe developing countries that offered investment opportunities.
Key Features of Emerging Markets:
Rapid Economic Growth – Higher GDP growth rates compared to developed economies.
Industrialization – Transition from agriculture-driven economies to manufacturing and services.
Urbanization – Large-scale migration from rural to urban areas.
Expanding Middle Class – Rising income levels and consumer demand.
Financial Market Development – Stock exchanges, bond markets, and banking systems are evolving.
Volatility & Risk – Political instability, weaker institutions, and external dependence.
Examples:
China & India: Asia’s powerhouses, shaping global trade and technology.
Brazil & Mexico: Latin American giants with commodity and manufacturing influence.
South Africa & Nigeria: African leaders in mining, oil, and population growth.
Turkey & Poland: Bridging Europe and Asia with strategic significance.
2. Economic Impact of Emerging Markets
Emerging markets are no longer just the “junior players” of the global economy—they are becoming growth engines.
Contribution to Global GDP
In 2000, EMs accounted for about 24% of global GDP.
By 2025, they contribute nearly 40–45% of global GDP, with China and India leading.
Consumption Power
By 2030, EMs are expected to account for two-thirds of global middle-class consumption.
Rising disposable incomes mean demand for cars, housing, technology, and branded goods.
Labor & Demographics
EMs often have younger populations compared to aging developed economies.
India, for instance, has a median age of around 28, compared to 38 in the U.S. and 47 in Japan.
This “demographic dividend” fuels productivity and innovation.
Industrial & Tech Transformation
China became the “world’s factory” over the past three decades.
India has emerged as a global IT hub.
Countries like Vietnam, Bangladesh, and Mexico are rising as new manufacturing centers.
3. Financial Impact
Emerging markets play a huge role in global financial markets, attracting foreign investment while also creating risks.
Foreign Direct Investment (FDI)
EMs attract trillions in FDI, driven by cheaper labor, large markets, and natural resources.
For example, multinational giants like Apple, Tesla, and Unilever rely heavily on EM production bases.
Stock Market Growth
Exchanges like Shanghai, Bombay, São Paulo, and Johannesburg have grown rapidly.
MSCI Emerging Markets Index is a benchmark followed by global investors.
Volatility & Risk
EM currencies (like the Indian Rupee, Brazilian Real, Turkish Lira) are prone to fluctuations.
Debt crises (Argentina, Turkey) show vulnerabilities.
Political instability often creates market shocks.
Capital Flows
EMs depend heavily on global liquidity.
U.S. interest rate hikes often lead to capital outflows from EMs, weakening currencies and causing crises (e.g., 2013 taper tantrum).
4. Trade & Globalization
Emerging markets are deeply tied to global trade flows.
Supply Chains
China dominates electronics, steel, and textiles.
Vietnam and Bangladesh are global clothing suppliers.
Mexico and Poland are key auto manufacturing hubs.
Commodities
Brazil and Argentina are agricultural superpowers.
Russia, South Africa, and Nigeria export oil, gas, and minerals.
This creates a commodity cycle linkage: when EM demand rises, commodity prices soar globally.
Trade Balances
Many EMs run surpluses due to strong exports (China, Vietnam).
Others run deficits due to import dependency (India, Turkey).
5. Social & Development Impact
Emerging markets impact society in profound ways.
Poverty Reduction: Millions lifted out of poverty in China and India.
Urbanization: Creation of megacities like Shanghai, Mumbai, São Paulo.
Education & Skills: Expanding universities and digital adoption.
Technology Leapfrogging: Africa moving directly from no-banking to mobile payments (M-Pesa).
Health Improvements: Longer life expectancy and reduced infant mortality.
However, inequality persists—rapid growth often benefits urban elites more than rural poor.
6. Geopolitical & Strategic Impact
Emerging markets are not just economic stories—they influence geopolitics.
China’s Belt & Road Initiative (BRI) expands infrastructure and political influence.
India plays a balancing role between the U.S. and China.
BRICS (Brazil, Russia, India, China, South Africa) aims to counter Western dominance.
EMs often act as swing players in global institutions (IMF, WTO, UN).
Their rising clout is shifting the balance of power from West to East and South.
7. Environmental & Sustainability Impact
Emerging markets are at the heart of the climate challenge.
They are major contributors to carbon emissions (China is #1).
At the same time, they are most vulnerable to climate change—floods, heatwaves, droughts.
Many EMs are investing in renewables (India’s solar parks, Brazil’s ethanol, China’s EVs).
ESG (Environmental, Social, Governance) investing is influencing EM companies to adopt greener practices.
8. Risks of Emerging Markets
While EMs offer opportunities, they also carry risks:
Political Instability – Coups, corruption, weak institutions.
Currency Volatility – Sharp depreciations can trigger crises.
Debt Burden – External borrowing creates vulnerability.
Trade Dependency – Heavy reliance on exports makes them vulnerable to global slowdowns.
Regulatory Uncertainty – Sudden changes in policies discourage investors.
Geopolitical Conflicts – Wars, sanctions, and trade wars hit EM economies hard.
9. Opportunities in Emerging Markets
For investors, EMs present high-growth opportunities:
Consumer Markets: Rising middle class drives demand for luxury goods, smartphones, healthcare, and education.
Infrastructure Development: Roads, ports, power plants—huge investment needs.
Digital Economy: E-commerce, fintech, mobile banking booming.
Energy Transition: Renewable energy projects are scaling fast.
Venture Capital: Startups in India, Africa, and Latin America are attracting global funding.
10. Future Outlook
By 2050, many emerging markets could dominate the global economy.
China: May remain the largest economy.
India: Could surpass the U.S. in GDP by mid-century.
Africa: With the fastest population growth, could be the new frontier.
Latin America: If political stability improves, it could rise as a major supplier of food and energy.
However, the path will not be smooth. EMs must balance growth with sustainability, strengthen institutions, and manage geopolitical tensions.
Conclusion
The impact of emerging markets is one of the most important forces shaping the 21st century. They are no longer passive participants but active shapers of trade, finance, technology, and geopolitics. Their rise has created new opportunities for businesses and investors but also introduced new risks and uncertainties.
In simple terms, the story of emerging markets is the story of the future of the global economy. They bring growth, innovation, and dynamism—but also complexity and volatility. Anyone interested in trade, finance, or policy must pay close attention to these rising economies, because their impact is already being felt everywhere—from Wall Street to Silicon Valley, from African villages to Asian megacities.
Derivatives Trading in Emerging Markets1. Understanding Derivatives in Simple Terms
A derivative is essentially a financial contract whose value is derived from an underlying asset. That asset could be anything — stocks, bonds, currencies, commodities, or even interest rates.
Think of it like this:
If you and your friend bet on whether the price of gold will go up or down next month, you’ve entered into a type of derivative contract.
The bet itself has no standalone value; it derives its worth from the movement of gold prices.
The most common types of derivatives include:
Futures Contracts – Agreements to buy or sell an asset at a fixed price on a future date.
Options Contracts – Rights (but not obligations) to buy or sell an asset at a specific price before a given date.
Forwards Contracts – Custom, over-the-counter (OTC) agreements similar to futures, but privately negotiated.
Swaps – Agreements to exchange cash flows, such as fixed interest for floating interest.
In developed economies, derivatives trading is massive. The notional value of global derivatives markets runs into hundreds of trillions of dollars. But in emerging markets, the journey is still evolving.
2. Why Derivatives Matter in Emerging Markets
Emerging markets — like India, Brazil, China, South Africa, Mexico, and Turkey — are characterized by fast economic growth, higher volatility, and developing financial institutions.
Here’s why derivatives play such a crucial role in these economies:
Risk Management (Hedging)
Commodity producers (like farmers in India or oil exporters in Brazil) face price volatility. Derivatives allow them to lock in prices and reduce uncertainty.
For example, an Indian farmer can use a futures contract on wheat to protect against falling prices during harvest.
Price Discovery
Derivatives markets help determine fair prices of commodities and financial assets. Futures on stock indices or currencies often reflect real-time demand-supply expectations.
Liquidity & Market Depth
They increase participation in markets. A liquid derivatives market often boosts liquidity in the cash (spot) market as well.
Investment Opportunities
For global investors, derivatives provide exposure to emerging market growth stories without needing to directly own local stocks or bonds.
Integration with Global Finance
Derivatives connect emerging markets with global capital flows, making them part of the broader financial ecosystem.
3. Historical Development of Derivatives in Emerging Markets
The journey of derivatives in emerging economies is relatively recent compared to the U.S. or Europe. Let’s take a quick tour:
India
India banned derivatives trading in 1952 due to speculation risks.
In 2000, it reintroduced derivatives on stock indices and later expanded into single-stock futures, options, and commodity derivatives.
Today, India has one of the largest derivatives markets in the world by volume.
Brazil
BM&F Bovespa (now part of B3 exchange) has been a pioneer in Latin America.
It introduced futures contracts on commodities like coffee and later expanded into financial derivatives.
China
Initially cautious due to speculation risks, China opened derivatives trading in the 1990s.
Today, the Shanghai Futures Exchange and China Financial Futures Exchange trade a wide range of contracts.
South Africa
The Johannesburg Stock Exchange (JSE) has a robust derivatives segment, including agricultural futures.
Turkey & Mexico
Both countries have developed active currency and interest rate derivative markets, driven by macroeconomic volatility.
The common thread? Derivatives in emerging markets often start with commodities (agriculture, metals, or energy) and later expand into financial products.
4. Key Types of Derivatives in Emerging Markets
a. Commodity Derivatives
Farmers, miners, and exporters rely heavily on futures and options.
Example: Brazil’s coffee futures, India’s gold futures, and South Africa’s maize futures.
b. Equity Derivatives
Stock index futures and options are increasingly popular.
India’s Nifty50 futures are among the most traded globally.
c. Currency Derivatives
Emerging markets often face currency volatility due to capital flows.
Currency futures (like USD/INR in India) help businesses hedge exchange rate risks.
d. Interest Rate Derivatives
Less developed compared to developed nations, but growing fast.
For example, Mexico and Turkey have active interest rate swap markets due to inflation risks.
5. Opportunities in Derivatives Trading in Emerging Markets
Emerging markets present unique opportunities for traders, investors, and institutions:
High Growth Potential
As economies grow, demand for derivatives rises.
Market Inefficiencies
Emerging markets often display mispricing due to less competition, creating arbitrage opportunities.
Commodity Exposure
Emerging economies are major commodity producers. Derivatives give exposure to commodities like oil, metals, and agriculture.
Retail Participation
In markets like India, retail investors are driving growth in equity derivatives.
Global Diversification
International investors can diversify by accessing emerging market derivatives.
6. Risks and Challenges
While the opportunities are strong, derivatives in emerging markets come with risks:
Volatility
Emerging markets often face sharp price swings due to political or economic shocks.
Regulatory Uncertainty
Policies can change overnight, restricting or liberalizing derivative trading.
Liquidity Issues
Some contracts lack depth, making it hard to exit positions.
Counterparty Risk
In over-the-counter markets, the risk of default is higher.
Speculation vs. Hedging
Regulators often worry about excessive speculation destabilizing markets.
Lack of Awareness
Many small businesses or retail traders in emerging markets don’t fully understand derivatives, leading to misuse.
7. Regulatory Landscape
Regulation plays a defining role in shaping derivative markets.
India: The Securities and Exchange Board of India (SEBI) oversees derivatives trading. It has gradually opened the market but remains cautious about speculation.
Brazil: B3 Exchange operates under the Brazilian Securities and Exchange Commission (CVM).
China: The China Securities Regulatory Commission (CSRC) keeps a tight grip, limiting speculative contracts.
South Africa: The Financial Sector Conduct Authority regulates derivatives under the JSE.
A common theme is balancing market development with financial stability. Too much speculation could cause systemic risks; too much control could stifle growth.
8. Case Studies
Case 1: India’s Nifty Derivatives Boom
Nifty index futures and options dominate global trading volumes.
Low margin requirements and high retail participation fueled this growth.
Case 2: Brazil’s Coffee Futures
Brazil is the world’s largest coffee producer. Coffee futures contracts in São Paulo provide global benchmarks for pricing.
Case 3: China’s Cautious Path
China introduced stock index futures in 2010 but imposed heavy restrictions after the 2015 market crash. This shows the delicate balance regulators maintain.
9. The Future of Derivatives in Emerging Markets
The next decade could see explosive growth in emerging market derivatives:
Digital Platforms & Fintech
Online trading apps will democratize access.
ESG & Green Derivatives
New contracts may emerge around carbon credits and renewable energy.
Cross-Border Trading
Greater integration with global exchanges.
Blockchain & Smart Contracts
Could reduce counterparty risks and improve transparency.
Retail Power
Just like in India, retail traders will drive volume growth in many countries.
10. Conclusion
Derivatives trading in emerging markets is both a story of promise and caution. On one hand, these instruments help farmers, exporters, and investors hedge against volatility, improve price discovery, and connect to global finance. On the other, misuse and over-speculation can destabilize fragile economies.
For investors, derivatives in emerging markets are not just about chasing profits — they are about understanding the heartbeat of fast-growing economies. As regulations mature, technology spreads, and education improves, these markets could very well become the engines of global derivatives growth.
Using Amazon as an example to write about intrinsic valueThe beautiful thing about equities, is that we can determine what the stock should be worth based on the future cash flows the company generates. It is called intrinsic value and professional investors often use this calculation to help them make higher quality decisions. The primary method of calculation is called discount cash flow. When building a DCF model is is recommended to use Wall Streets estimates to keep an unbiased opinion.
Understanding the concept of discount cash flow, is like understanding the calculations behind any technical indicator, the thing about intrinsic value is that it is a fundamental indication not just technical. Equities go up, because companies are generating cash flows. Unlike commodities, which are only valued based on the general consensus of voters.
It was Benjamin Graham the father of value investing who said, in the short term the market is a voting machine, but in the long term the market is a weighing machine. There is a fantastic book I read called The Intelligent Investor written by Benjamin Graham I highly recommend giving it a read if your serious about making money in the market over the long term.
Intrinsic value is the fundamental, true worth of an asset or business, as determined by an objective analysis of its financial performance and future cash flow potential. It is a crucial concept for investors, especially value investors, who use it to identify assets that are undervalued or overvalued by the market.
Focusing on fundamentals helps investors avoid overpaying for assets and reduces the risk of permanent capital loss. If a stock's market price is significantly lower than its calculated intrinsic value, it may be undervalued and a good buying opportunity. The difference is often called a "margin of safety". Intrinsic value is based on an asset's long-term potential, encouraging a focus on sustainable growth and stability rather than short-term market noise.
Now onto Amazon stock, according to my model the intrinsic value of Amazon is as of this writing $260 meaning that fundamentally it is still undervalued. Take this with a grain of salt because if you create a model using the discount cash flows of the company over the next 5 or 10 years you might get wildly different results. This is why it is essential to understand the calculation for yourself instead of just taking my word for it. This is a highly speculative calculation, it can also become relatively complicated.
Lets compare two individuals performance over the course of their career, I would like to write about Dr. Al Brooks, often referred to as the king of price action by CME group, and Warren Buffett, one of the most successful investors and richest men in the world. Al Brooks, the day traders net worth is about $750 million dollars over the course of his career in the market. Warren Buffett has a net worth of about $150 billion dollars. One is a trader, the other an investor. So where am I going with this?
Everyone wants to get rich quick, everyone starts thinking they will be a trader. 90% of traders permanently lose their capital never to make it back and often times quitting participating in the market. The 10% of traders who are actually profitable, aren't making as much money as you would think, as per the comparison above. The average investor over the course of their lifetime will make 150x more money than the best traders. For me, I fell into the 90% category, trading didn't work for me, after reading The Intelligent Investor, the money starting coming into my account almost effortlessly.
Dear reader, this article was written by me for my own entertainment. Please do not take anything I have written too literally, always do what works best for you and always remember, whatever your doing, you should be having fun. Cheers
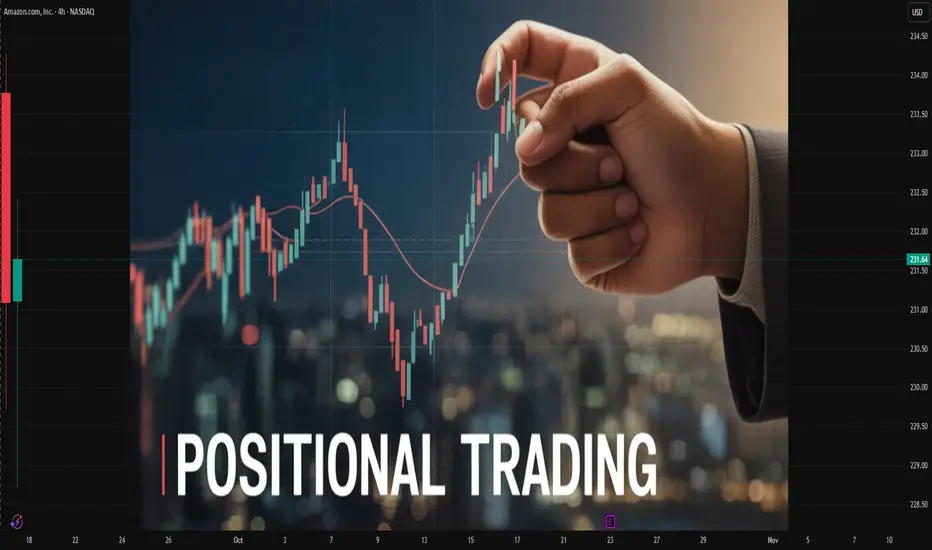
Risk vs Reward: How Positional Traders Manage Market SwingsChapter 1: The Nature of Positional Trading
1.1 Defining Positional Trading
Positional trading is a strategy where traders hold positions for extended periods, often ranging from several weeks to several months, with the goal of capturing larger price movements. Unlike intraday or swing traders, positional traders are less concerned with short-term noise. Instead, they rely on broader fundamental themes, technical trends, and macroeconomic cycles.
1.2 Characteristics of Positional Trading
Time Horizon: Longer than swing trading but shorter than long-term investing.
Analysis: Combination of technical indicators (trendlines, moving averages, volume profile) and fundamental analysis (earnings, global events, monetary policy).
Risk Tolerance: Moderate to high, since positions are exposed to overnight and weekend risks.
Capital Allocation: Positions are often larger than swing trades, requiring strict risk management.
1.3 Why Traders Choose Positional Trading
Ability to capture big moves in trending markets.
Lower stress compared to day trading (fewer trades, less screen time).
Flexibility to balance trading with other commitments.
Opportunity to benefit from structural themes such as interest rate cycles, technological disruptions, or geopolitical developments.
Chapter 2: The Core Principle – Risk vs Reward
2.1 Understanding Risk
In trading, risk is not just the possibility of losing money—it also includes the uncertainty of outcomes. For positional traders, risk manifests as:
Price Volatility: Sudden swings due to earnings reports, macroeconomic data, or geopolitical events.
Gap Risk: Overnight or weekend news causing sharp market gaps.
Trend Reversal: A strong uptrend suddenly turning bearish.
Opportunity Cost: Capital locked in a stagnant trade while better opportunities emerge elsewhere.
2.2 Understanding Reward
Reward refers to the potential gain a trader expects from a trade. For positional traders, rewards typically come from:
Riding long-term trends (e.g., a bullish rally in technology stocks).
Capturing multi-month breakouts in commodities or currencies.
Benefiting from sectoral rotations where capital shifts between industries.
2.3 The Risk-Reward Ratio
A foundational tool for positional traders is the risk-reward ratio (RRR), which compares potential profit to potential loss. For example:
If a trader risks ₹10,000 for a possible gain of ₹30,000, the RRR is 1:3.
A higher RRR ensures that even if several trades go wrong, a few winning trades can offset losses.
Most positional traders aim for a minimum of 1:2 or 1:3 risk-reward ratios to sustain profitability.
Chapter 3: Market Swings – The Double-Edged Sword
3.1 What Are Market Swings?
Market swings refer to sharp upward or downward price movements over short to medium periods. They are caused by factors like:
Earnings surprises
Central bank announcements
Political instability
Global commodity price shocks
Investor sentiment shifts
3.2 Friend or Foe?
For positional traders, market swings can be:
Friend: Accelerating profits when positioned correctly.
Foe: Triggering stop-losses and eroding capital when caught off-guard.
3.3 The Positional Trader’s Dilemma
Market swings often force traders into a psychological tug-of-war:
Should they hold through volatility in hopes of a larger trend?
Or should they exit early to preserve gains?
The right answer depends on risk appetite, conviction in analysis, and adherence to strategy.
Chapter 4: Tools of Risk Management
4.1 Stop-Loss Orders
The most basic and effective tool for limiting downside risk.
Hard Stop-Loss: A predefined price level where the position is exited.
Trailing Stop-Loss: Moves upward (or downward in shorts) as the trade becomes profitable, locking in gains while allowing room for continuation.
4.2 Position Sizing
Deciding how much capital to allocate per trade is crucial. A common rule is risking no more than 1-2% of total capital on a single trade. This prevents a single loss from wiping out the account.
4.3 Diversification
Holding positions across different asset classes or sectors reduces exposure to idiosyncratic risks. For example, combining technology stocks with commodity trades.
4.4 Hedging
Advanced positional traders may use options, futures, or inverse ETFs to hedge risks. For instance, buying protective puts while holding long equity positions.
4.5 Patience and Discipline
No tool is more important than discipline. Sticking to pre-defined plans and resisting the urge to overreact to market noise often separates successful traders from the rest.
Chapter 5: Strategies to Maximize Reward
5.1 Trend Following
Using moving averages, MACD, or ADX to identify strong directional trends.
Entering trades in alignment with the broader trend rather than against it.
5.2 Breakout Trading
Entering trades when an asset breaks through a key resistance or support level with high volume.
Positional traders often ride multi-month breakouts.
5.3 Fundamental Catalysts
Aligning trades with earnings cycles, government policies, or macroeconomic themes.
Example: Investing in renewable energy stocks during a policy push for green energy.
5.4 Sector Rotation
Shifting positions as capital flows between sectors.
Example: Moving from banking to IT during periods of rate cuts.
5.5 Pyramid Positioning
Adding to winning trades gradually as trends confirm themselves.
Ensures exposure grows only when the market supports the thesis.
Chapter 6: Psychology of Positional Trading
6.1 The Fear of Missing Out (FOMO)
Traders often chase after rallies late, increasing risk. Successful positional traders resist this urge and wait for setups aligned with their strategies.
6.2 Greed vs. Discipline
Holding too long for extra gains can turn profits into losses. Discipline ensures profits are booked systematically.
6.3 Handling Drawdowns
Market swings inevitably lead to losing streaks. Accepting drawdowns as part of the journey helps maintain mental balance.
6.4 Patience as a Weapon
Unlike day traders, positional traders must often endure long periods of stagnation before trends materialize. Patience is not passive—it is an active tool in their arsenal.
Chapter 7: Lessons for Traders and Investors
Risk is inevitable but manageable – Market swings cannot be eliminated, but tools like stop-losses and diversification reduce their impact.
Reward requires patience – Larger profits are earned by holding through volatility, not by constantly jumping in and out.
Discipline beats prediction – Following rules matters more than correctly forecasting every swing.
Adaptability is key – Global events can shift markets suddenly; traders must be flexible.
Psychology is half the battle – A calm, patient mindset sustains traders through market storms.
Conclusion
Positional trading is not about avoiding market swings—it is about managing them. Every swing presents both a threat and an opportunity. The difference lies in how traders handle them. Those who respect risk, apply disciplined strategies, and patiently wait for reward tend to emerge stronger, while those swayed by fear, greed, or impulsiveness often fall behind.
The essence of risk vs reward in positional trading is best captured as a dance: risk sets the rhythm, reward provides the melody, and discipline keeps the trader moving in sync. In a world where markets will always swing—sometimes violently—the art lies not in predicting every move but in managing exposure, aligning with trends, and staying calm in the face of uncertainty.
For anyone seeking to thrive as a positional trader, the golden rule remains: protect your downside, and the upside will take care of itself.