WDC, MACD Histogram just turned positiveThis is a Bullish indicator signaling WDC's price could rise from here. Traders may explore going long the stock or buying call options. Tickeron A.I. dvisor identified 42 similar cases where WDC's MACD histogram became positive, and 33 of them led to successful outcomes. Odds of Success: 79%. Current price $38.21 crossed the support line at $38.44 and is trading between $38.44 support and $37.84 resistance lines. Throughout the month of 09/08/20 - 10/08/20, the price experienced a +6% Uptrend. During the week of 10/01/20 - 10/08/20, the stock enjoyed a +7% Uptrend growth.
Bullish Trend Analysis
The RSI Oscillator points to a transition from a downward trend to an upward trend -- in cases where WDC's RSI Oscillator exited the oversold zone, 20 of 30 resulted in an increase in price. Tickeron's analysis proposes that the odds of a continued upward trend are 67%.
The Momentum Indicator moved above the 0 level on October 08, 2020. You may want to consider a long position or call options on WDC as a result. Tickeron A.I. detected that in 61 of 86 past instances where the momentum indicator moved above 0, the stock continued to climb. The odds of a continued upward trend are 71%.
The Moving Average Convergence Divergence (MACD) for WDC just turned positive on October 08, 2020. Looking at past instances where WDC's MACD turned positive, the stock continued to rise, Tickeron A.I. shows that in 33 of 42 cases over the following month. The odds of a continued upward trend are 79%.
WDC moved above its 50-day Moving Average on October 08, 2020 date and that indicates a change from a downward trend to an upward trend.
Following a +6.73% 3-day Advance, the price is estimated to grow further. Considering data from situations where WDC advanced for three days, Tickeron A.I. shows that in 229 of 318 cases, the price rose further within the following month. The odds of a continued upward trend are 72%.
The Aroon Indicator entered an Uptrend today. Tickeron A.I. shows that in 162 of 229 cases where WDC Aroon's Indicator entered an Uptrend, the price rose further within the following month. The odds of a continued Uptrend are 71%.
Trade ideas


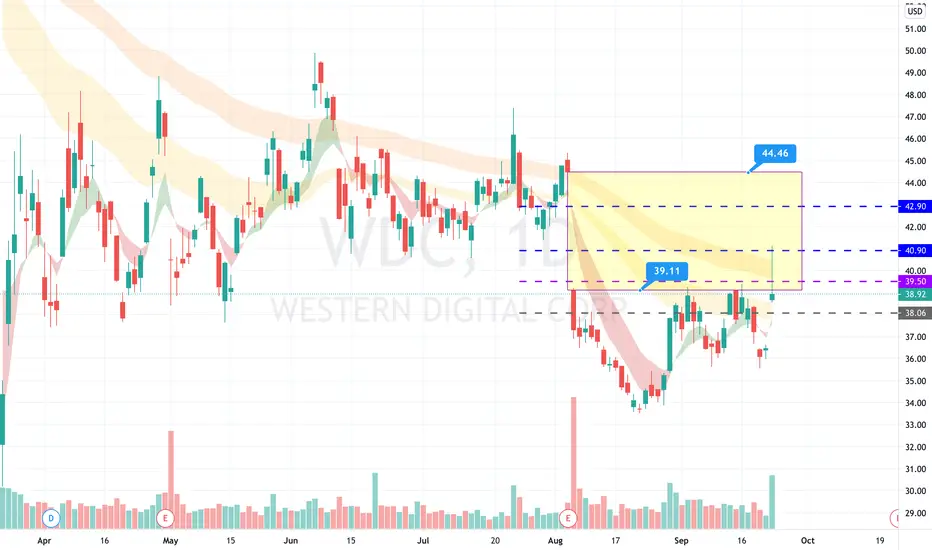
$WDC Swing Trade Setup in Western Digital
WDC once again found resistance @ $39.00 but seems to
be building some momentum.
Alert is set for $39.60 with a large 10% gap fill above.
Much may depend on MU earnings after the close on Tuesday.

Large gap to fill above, unusual options activityCame up on the unusual options activity scanner and its easy to see why. From the long upper shadow of the candle you can see it tried to move thru the gap but likely followed the market and retreated. Given enough time, over a few sessions and some upward momentum in the market, this may fill to the upside.
$WDC Gap Fill trade In Western Digital
Potential Long entry on break above the 50ma.
upgrade to buy today.
Major gap fill potential in a stock which has underperformed
hugely since the market lows in March, 45% off its highs.

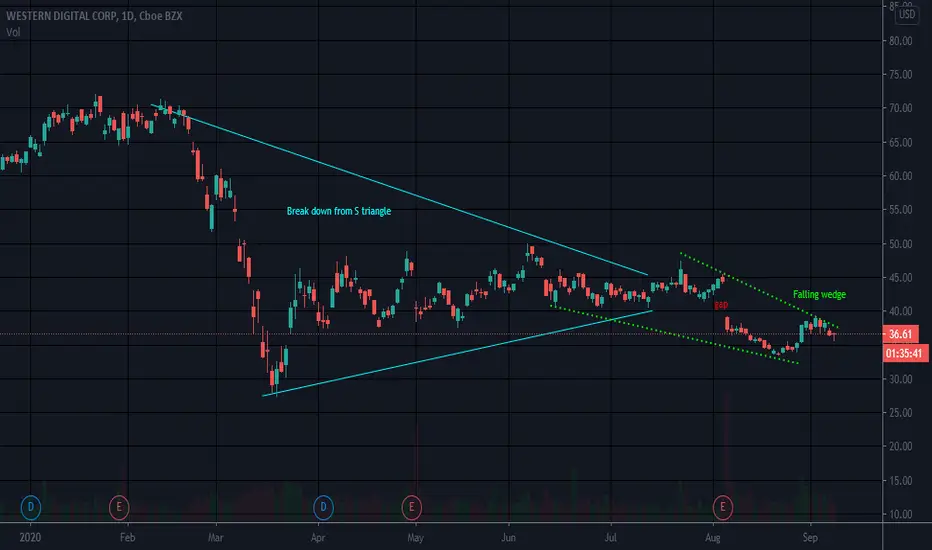
Falling Wedge Bottom FishingWDC had a break down from the S Triangle.
Seems to have formed a bottom at 33ish but yearly low is 27.4
A lot of R overhead starting with recent gap down
Not a recommendation
WDC, Technical reversal from low RSII really like low rsi plays but usually prefer to see stocks with low RSI undergo some consolidation before a move up , but we may not get that with WDC. So, that being said watch this closely if you enter .
Technicals look good with recent buying volume a nice reversal swing on the RSI . Took a position.
Target price is based on fib 0.618 level but is not set in stone.
Put call ratio 0.83 , looks good as well .
Good luck ~

WDC ForecastThis is a forecast about Western Digital Corporation.
Soon I will update this, and aim for a higher TP.
Always open for feedback.

$WDC - Potential long entry above resistance "Area of Hope" Look at the chart to understand the area
Not for any advise
Just an Idea,

Cypher Pattern - Waiting on ConfirmationCharted several Cypher Patterns previous, pattern was rejected when Pandemic took effect. Another pattern has come to fruition. It may drop lower but if it breaks $35.00 it may be on it's way back to $50-$60. Being patient....

WDC Missed earnings an opportunity?Just released a earnings and guided lower. Taking a beating in the after hours. Currently trading at $39. Gap to fill at $35.

WDC WESTERN DIGITAL CORP 68.02% upside potential I have 45 Western Digital hard drives without any issues in many years. In my opinion Western Digital is the best affordable storage devices company.
8/6/2020 Morgan Stanley Lower Price Target Overweight $63.00 ➝ $58.50
8/6/2020 Wells Fargo & Co Lower Price Target Overweight $60.00 ➝ $55.00
8/6/2020 Bank of America Lower Price Target Buy $61.00 ➝ $52.00
8/6/2020 Robert W. Baird Lower Price Target Outperform $75.00 ➝ $50.00
Market Cap$11.02 billion
Annual Sales$16.74 billion
Net Income$-250,000,000
If you are interested to test some amazing BUY and SELL INDICATORS, which give the signal at the beginning of the candle, not at the end of it, just leave me a message.

WDC - This is the moment With RSI 30 (oversold) and the support level at 35.50
I think this is good opportunity to buy.

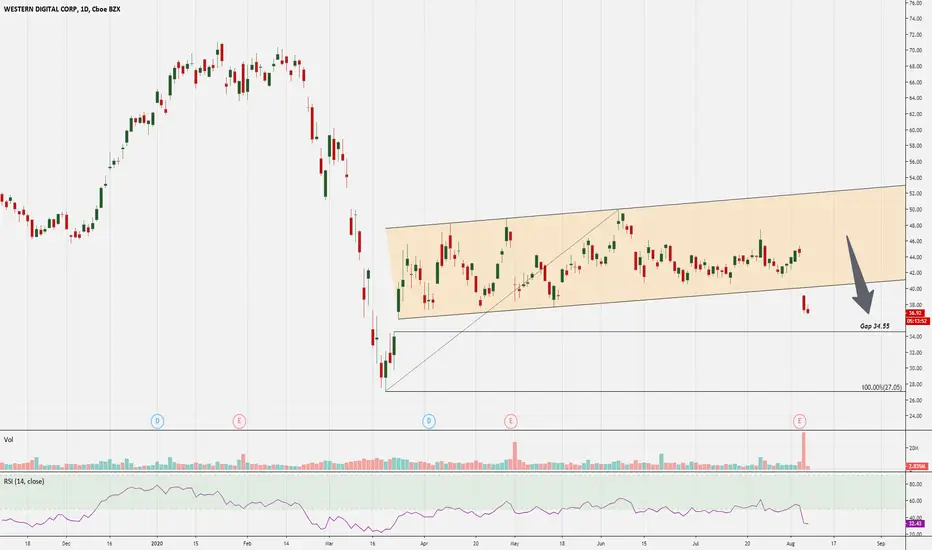
$WDC - I see the Gap below The stock broke the positive trend after the publication of quarterly financial report and may continue to be negative in the near future.
I see the gap below, 34.55$. might be the support area.
Not for any advice,
Just an Idea.
$WDC Western Digital catchup Trade
Possible trade into or post earnings.
Stock has been in consolidation for 4 months and
perhaps earnings could give it the momentum needed to break from this range.
Stock is above the Point of control (POC)
Stochastic is rising and crossed
RSI is uptrending.
Volume has increased.
Stock is a huge laggard within the sector.
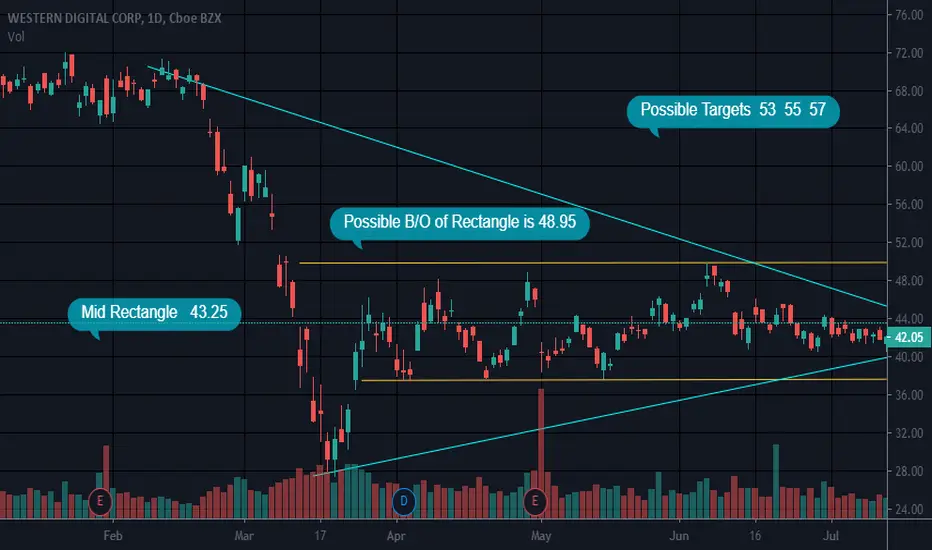
Resistance levels should be regarded as possible targets
PLEASE GIVE US A LIKE IF YOU FIND OUR CONTENT HELPFUL, THANK YOU.

Rectangle S TriangleEarnings 8-5 AMC
Considered by many to be a value stock/I think the growth expectations may be what holds this one back..dunno
I have owned it in the past for a nice run..so she can move when she gets going
Swing trading from rectangle boundaries is another idea
I am waiting on volume to pick up a bit
If WDC starts moving I would re-evaluate my targets and extend my targets if it is looking good. Prior high of 72.46 in the past year with an all time high of 114.69. WDC has to break rectangle first I think
Not a recommendation
$WDC primed off low volumeVolume is below average. Sellers getting tired.
Indicators look fine.
Look for breakout toward $50

$WDCAnything above 43.29 is good for long entry, still no confirmation but worth taking chance for next ER

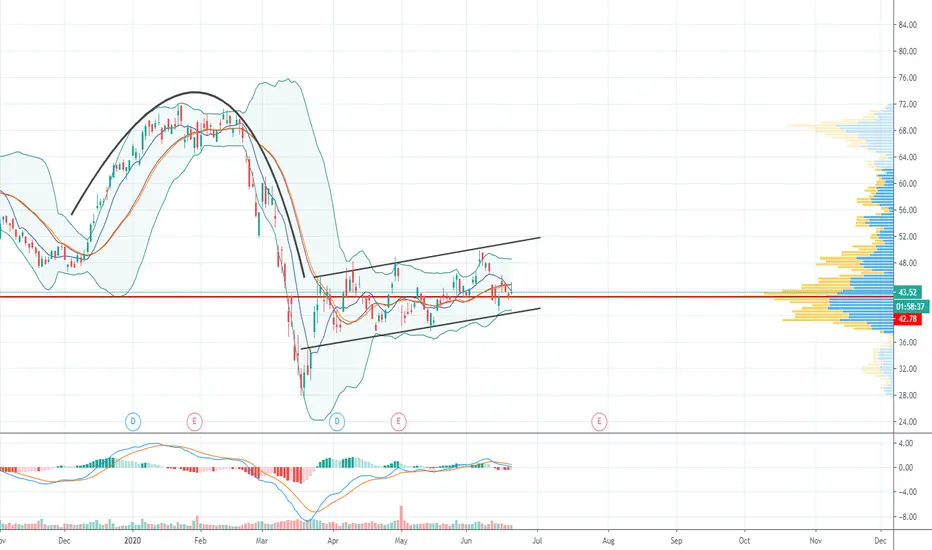

Sideways trends on WDCAnalysis explained:
1. Support zone identified by multiple lows bouncing at the same line, validated by volume profile (at left).
2. Channel identified, confirmed with volume profile (to see this confirmation you must change the chart for 4hrs instead)
3. Check the volume to confirm when the bounce is happening.
Expectations: wait for a new bounce (to buy) or wait for a new breakout, always confirming with volume.
Best Regards,
Roberto


Western Digital Corporation (WDC) short.All description on the chart.
Please, don't forget to like and follow.
Thank you.
