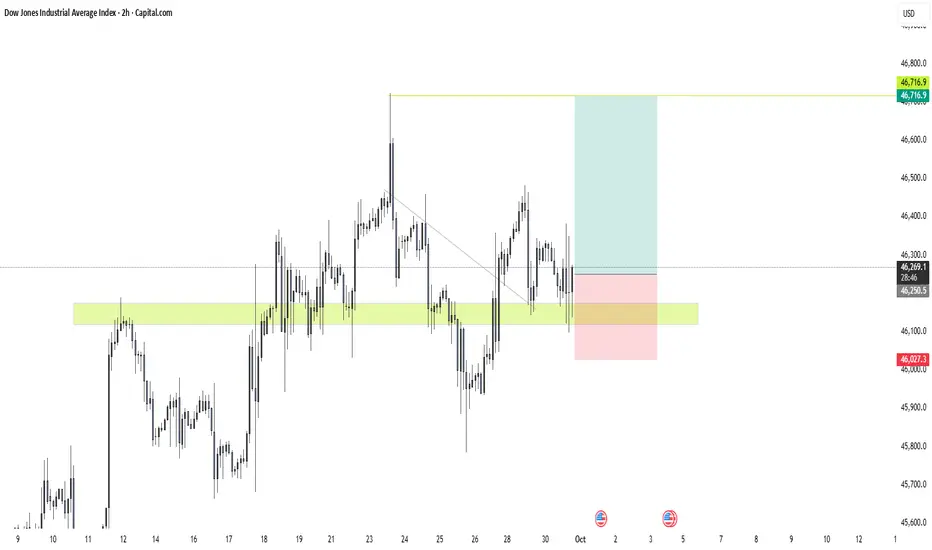
DowJones consolidation supported at 46420Key Support and Resistance Levels
Resistance Level 1: 46930
Resistance Level 2: 47060
Resistance Level 3: 47200
Support Level 1: 46420
Support Level 2: 46290
Support Level 3: 46190
This communication is for informational purposes only and should not be viewed as any form of recommendation as to a particular course of action or as investment advice. It is not intended as an offer or solicitation for the purchase or sale of any financial instrument or as an official confirmation of any transaction. Opinions, estimates and assumptions expressed herein are made as of the date of this communication and are subject to change without notice. This communication has been prepared based upon information, including market prices, data and other information, believed to be reliable; however, Trade Nation does not warrant its completeness or accuracy. All market prices and market data contained in or attached to this communication are indicative and subject to change without notice.
WALLSTREETCFD trade ideas

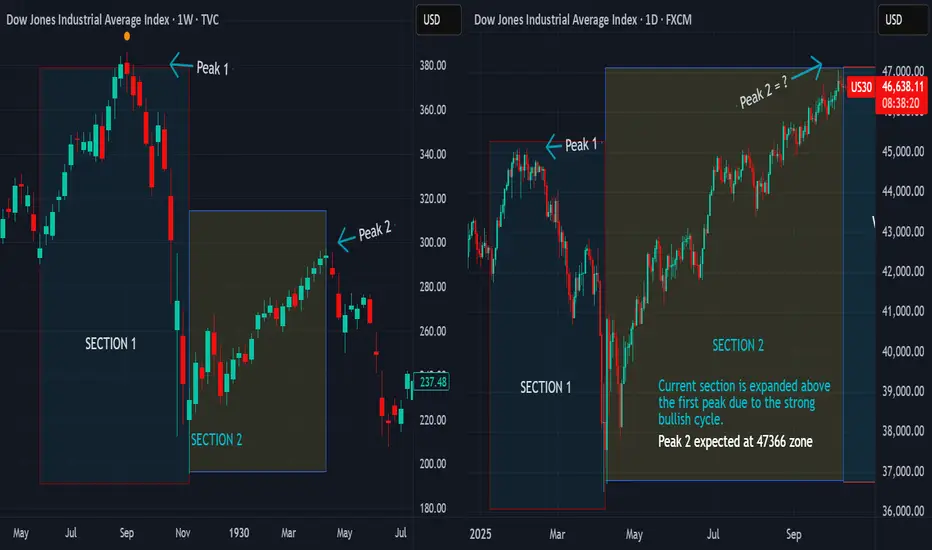
MARKETS AT CROSSROADS... THE STORIES OF TOMMORROWA picture is worth a thousand words.
We are comparing the 7-months cycle currently unravelling with its fractal counterparts that have repeated with striking periodicity in the past.
We will compare the trends that follow the completion of the cycle in each of the fractals.
Fractal 1 - (28/06/1965 - 07/02/1966) compared to (07/04/2025 to present)
Fractal 2 (19/10/1987 - 16/07/1990) compared to present
Fractal 3 (07/10/2002 - 16/10/2007) compared to present
In the last two shots, we have represented the entire 5-year cycle so we could see the entire picture for a clearer view. It is interesting to note that the last 7-months cycle is itself a fractal of the entire 5-year cycle.
There are several of them but we would represent only three to make the illustrations simpler.
FOR THE TRENDS THAT FOLLOW THE COMPLETION OF THESE FRACTALS...
April 1930 - July 1932
Feb 1966 - October 1966
July 1990 - October 1990
October 2007 - March 2009
5 out of 5 the market corrected at completion of this cycle. Also by observation the declines are sharp and the recoveries are massive, starting a second wave of hyper-bullish trends
TWO OCCASSIONS WHERE THE CORRECTION WAS PROLONGED
WHATS AHEAD...?
Markets are running into a correction, between October 2025 to February 2026, we expect wide asset classes and global indices to stage a correction. The correction should be quick and sudden which likely would complete in April 2026. A second wave of sharp bullish trend would follow into 2027. We expect a second correction that could start from Feb/March 2027 making a bottom in October 2027. This bottom will be the base for the next 5-year hyper-bullish trend completing the entire 13-year Cycle from 2020.
Follow and check back for the price levels breakdown
Trade safe and good luck.
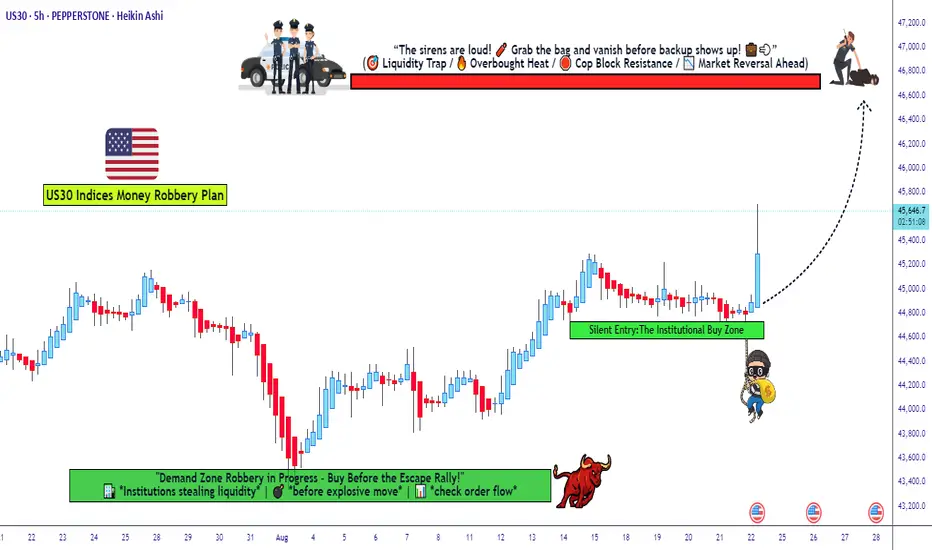
Dow Jones Bulls Preparing Another Robbery — Are You In?🚨💰 US30/DJ30 Index CFD Market Heist Plan 🏦🎭
🕵️ Dear Thief OG’s, Ladies & Gentlemen of the robbery squad… the vault is wide open again! This time we’re sneaking into the Dow Jones (US30) for a Bullish Day/Swing Heist. 🔥
🎯 Robbery Blueprint
Asset: US30/DJ30 Index CFD (Day/Swing Trade)
Plan: Bullish 📈
Entry (Thief Style):
The thief never knocks once… we layer the doors! Multiple buy limit orders 🔐:
Layer 1 → 45,600.0
Layer 2 → 45,400.0
Layer 3 → 45,200.0
(You can expand the layers depending on your risk appetite 🕳️)
Stop Loss (SL) 🛑:
📍 Thief SL @ 44,600.0
(Adjust based on your own risk & startergy – remember, survival is key in every robbery 🏃💨)
Target (TP) 🎯:
🚓 Police barricade spotted @47,000.0! Our sweet escape is planned at 46,800.0 before sirens catch us. 💰
🏆 Thief Strategy
Multiple limit order entries (layering method / scaling in).
Enter at any price level if you’re fast, but layering is the OG Thief move.
Manage your SL & risk like a pro robber – no reckless moves, or you’ll end up behind market bars! 🚔
💡 Why This Heist? 💡
The US30/DJ30 is primed for a bullish run 📈, driven by real-time market signals:
Technical Analysis: Strong support levels holding firm, momentum indicators screaming bullish! 📊
Fundamental Outlook: Check global market data, COT reports, and sentiment analysis for confirmation. 🔗👉
Volatility Watch: Stay sharp for news releases that could spike volatility. 📰⚠️
⚠️ Thief’s Risk Management ⚠️
News Alert: Avoid new trades during major news drops to dodge wild price swings. 🚫
Position Management: Use trailing stops to lock in those sweet profits. 🔐
Risk Control: Adjust lot sizes and SL based on your layered entries and risk profile. 📉
🏆 Join the Heist! 🏆
💥 Hit the Boost Button 💥 to power up our Thief Trader crew! 🚀 Let’s make bank with ease using the Thief Trading Style! 💸😎 Stay tuned for the next heist plan, and let’s keep robbing the markets! 🤑🐱👤
Dow Jones Swing Trade Setup – Is 48,000 the Next Stop?📈 US30 "Dow Jones Industrial Average" CFD: Thief's Wealth Strategy Map (Swing/Day Trade) 🚨
🎯 Swing/Day Trade Setup: US30 (Dow Jones Industrial Average CFD)
Get ready to sneak into the market with the Thief Strategy — a cheeky, layered limit-order approach to steal profits from the Wall Street shadows! 😎 This bullish plan is designed for swing or day trading, with a professional yet playful vibe to maximize your market heist. Let’s break it down! 🕵️♂️
🧠 Trade Idea: Bullish Heist on US30 🚀
Asset: US30 (Dow Jones Industrial Average Index CFD)
Market: Wealth Strategy Map (Swing/Day Trade)
Outlook: Bullish 📈
Strategy: The Thief Strategy — using multiple buy limit orders in a layered entry style to catch the best price levels. Think of it as setting traps for profits! 🕸️
📝 The Thief’s Plan: Layered Entry & Key Levels
🔑 Entry Strategy:
Deploy multiple buy limit orders to layer your entries like a master thief:
🎯 46,500
🎯 46,600
🎯 46,700
🎯 46,800
Pro Tip: Feel free to add more layers based on your risk appetite or market conditions. The more traps, the merrier! 😜
Flexible Entry: You can enter at any price level within this range, but layering helps you average into the position like a sneaky pro.
🔐 Stop Loss (SL):
Set at 46,300 — the Thief’s escape hatch! 🚪
Note: Dear Ladies & Gentlemen (Thief OGs 🕶️), this SL is my suggestion, but it’s your heist! Adjust based on your risk tolerance and account size. Only risk what you can afford to lose!
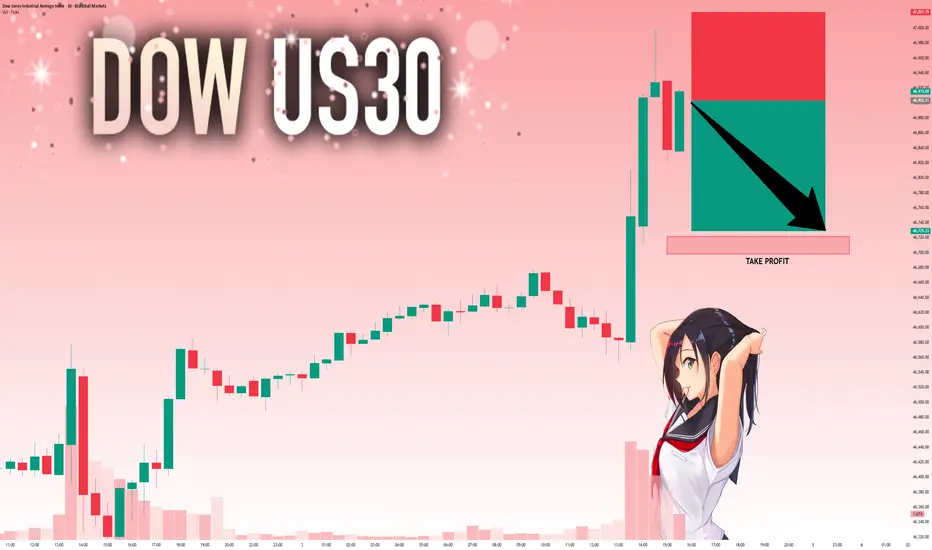
🎯 Take Profit (TP):
Primary target: 47,600 — a juicy profit zone before the Police Barricade (resistance) at 48,000.
Why 47,600? This level avoids the overbought trap and potential reversal at 48,000, where strong resistance and market shenanigans may lurk. 🕵️♂️
Note: Thief OGs, this TP is my call, but you’re the boss! Take profits at your own discretion and secure the bag. 💰
🔍 Why This Setup? Key Analysis Points
Market Context: The US30 is showing bullish momentum, supported by recent economic data and market sentiment (check social posts and financial news for real-time vibes).
Technical View:
The layered entry approach leverages potential pullbacks within a bullish trend, maximizing your entry efficiency.
The 46,300 SL is placed below key support to protect against sudden reversals.
The 48,000 level acts as a major resistance (overbought zone + psychological barrier), making 47,600 a safer TP.
Risk Management: The Thief Strategy spreads risk across multiple entry points, reducing the impact of volatility spikes.
💹 Related Pairs to Watch (Correlated Assets in USD)
To boost your market awareness, keep an eye on these correlated assets:
SP:SPX (S&P 500 Index CFD): Moves closely with US30 due to shared exposure to U.S. large-cap stocks. A bullish US30 often aligns with SPX strength. 📈
PEPPERSTONE:NAS100 (Nasdaq 100 Index CFD): Tech-heavy index that can amplify or diverge from US30 moves. Watch for tech sector momentum. 💻
FX:USDJPY (Forex Pair): A stronger USD often supports bullish US equity indices like US30. Monitor for USD strength or Yen weakness. 💵
Key Correlation Insight: If SP:SPX and PEPPERSTONE:NAS100 show similar bullish patterns, it reinforces the US30 setup. Conversely, a sharp USDJPY drop could signal caution for US indices.
⚠️ Disclaimer
This Thief Style trading strategy is just for fun and educational purposes! 😜 Trading involves risks, and past performance doesn’t guarantee future results. Always conduct your own analysis, manage risk wisely, and only trade what you can afford to lose.
✨ If you find value in my analysis, a 👍 and 🚀 boost is much appreciated — it helps me share more setups with the community!
#US30 #DowJones #ThiefStrategy #SwingTrading #DayTrading #Bullish #TechnicalAnalysis #TradingView #WealthStrategy

Dow Jones (US30) Analysis:The Dow Jones index continues to move in a short-term bearish trend, currently testing a key support level around 46,300.
🔻 Bearish Scenario:
If the price breaks below 46,300 and holds, it may head toward the liquidity zone near 46,100.
🔺 Bullish Scenario:
If the index rebounds from the current support and breaks above 46,490, it could push higher toward 46,650.
📌 Best Buy Zones: On a rebound from 46,300 or 46,100
📍 Best Sell Zone: Below 46,300

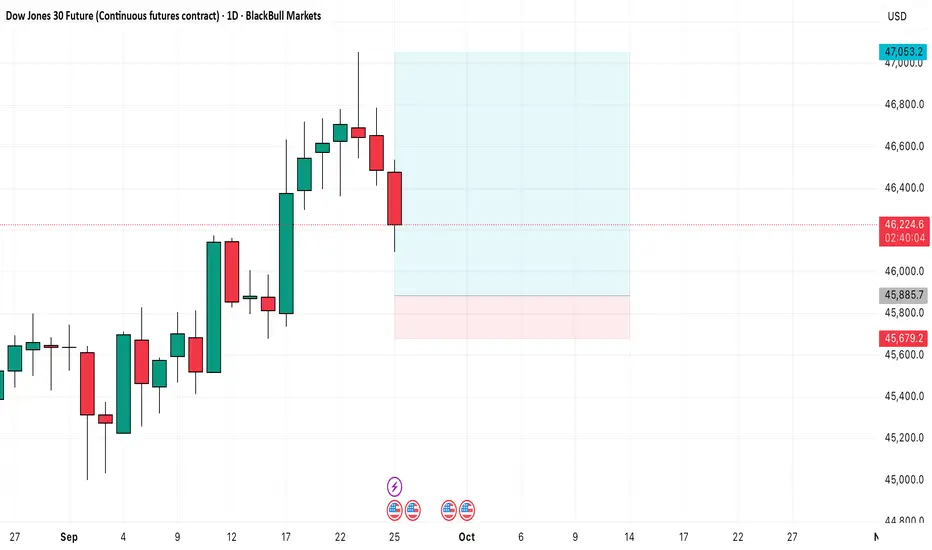
DOWFUT long setupDOWFUT long setup
Entry - 45885.7
Stop loss - 45679.2
Target - 47053.2
Risk Reward - 1:5.65
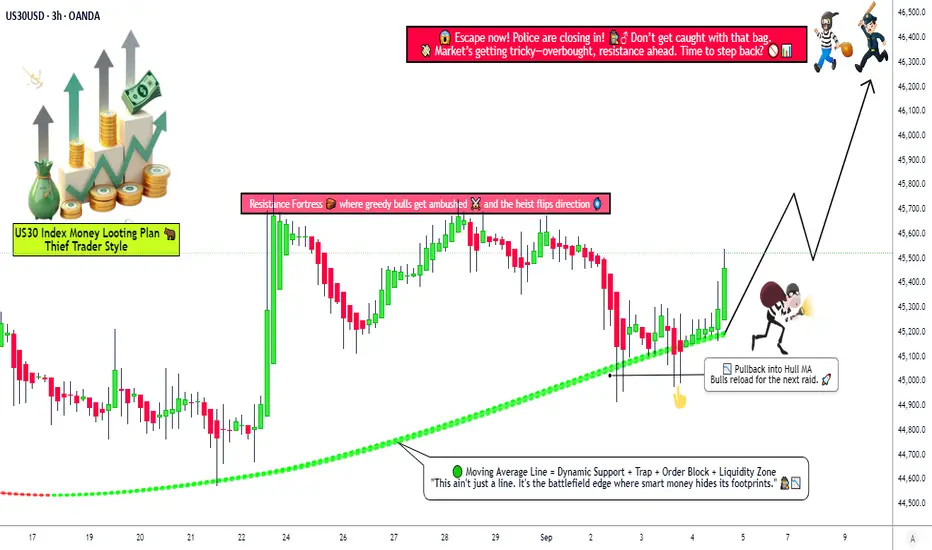
Dow Jones Bullish Strategy! Can the Market Break Higher?🚀 US30 Index Money-Making Plan (Swing / Day Trade) 📊
🧠 Trading Plan & Strategy (Thief Layer Style)
🚀 Approach: Bullish Hull Moving Average pullback plan — “bulls reloaded” for the next wave.
🎯 Entry (Layering Strategy): Multiple buy-limit layers → 45,200 • 45,300 • 45,400 • 45,500 (flexible to add more based on your own plan).
🛡️ Stop Loss: Reference point at 45,000. Adjust SL responsibly to match your personal risk tolerance & style.
💰 Target: Potential resistance zone (the “police barricade”) sits near 46,300. That’s where traders may consider taking profits.
📢 Note: This is an illustrative plan based on technicals — every trader should adapt TP/SL to their own strategy and risk appetite.
📊 US30 Market Report – September 4, 2025
📈 Current Price Snapshot
Trading near 45,000 points, up 0.05% today.
Strong monthly performance (+2.4%) and robust yearly gains (+17%).
Market showing resilience despite trade tensions.
😊 Retail Traders’ Sentiment
60% long vs 40% short → Tilted bullish.
Optimism driven by hopes for earnings growth & Fed rate cuts.
Caution remains due to tariff risks.
🏦 Institutional Traders’ Outlook
Cautiously bullish positioning.
Demand for equities continues, but with moderated exposure.
Buybacks + foreign inflows supporting price action.
🌡️ Overall Investor Mood
Neutral to positive tone.
Economic resilience balanced against policy uncertainty.
Healthy breadth across sectors, not just tech.
😨 Fear & Greed Index
Currently at 52 (Neutral).
Suggests balance — no extremes dominating.
Neutral setups often precede steady gains.
💹 Fundamental Score → 8/10
Strong corporate earnings (+12–13% growth projected next year).
Balance sheets remain solid.
AI & tech themes boosting key components.
Tariffs still a drag, but diversified exposure helps.
🌍 Macro Score → 7/10
US GDP growth cooling to 1.5%, but global rebound supports outlook.
Inflation ~2.9%; Fed rate cuts expected later.
Labor market stable, policy clarity could add upside.
🐂 Overall Market Outlook: Bullish Bias 📈
If support at 45,000 holds, potential move higher toward 46,000+.
Drivers: Strong earnings, Fed easing, broad rally.
Watch: Trade news headlines remain a key risk factor.
🔎 Why This Plan?
Hull MA pullback indicates momentum continuation.
Layered entries provide flexibility & better risk distribution.
Market sentiment + fundamentals align with bullish bias.
Resistance at 46,300 offers a clear take-profit zone.
📌 Related Pairs to Watch
CAPITALCOM:US30
FOREXCOM:SPX500
EIGHTCAP:NDQ100
TVC:VIX
TVC:DXY
✨ “If you find value in my analysis, a 👍 and 🚀 boost is much appreciated — it helps me share more setups with the community!”
#US30 #DowJones #Indices #SwingTrading #DayTrading #TechnicalAnalysis #StockMarket #TradingPlan #HullMA #LayeringStrategy
US30: Strong Bearish Sentiment! Short!
My dear friends,
Today we will analyse US30 together☺️
The recent price action suggests a shift in mid-term momentum. A break below the current local range around 46,903.31 will confirm the new direction downwards with the target being the next key level of 46,721.37 and a reconvened placement of a stop-loss beyond the range.
❤️Sending you lots of Love and Hugs❤️
uptrend It is expected that after some fluctuation and correction, the trend change will take place and we will witness the start of the uptrend. Then it will advance to the specified resistance levels.
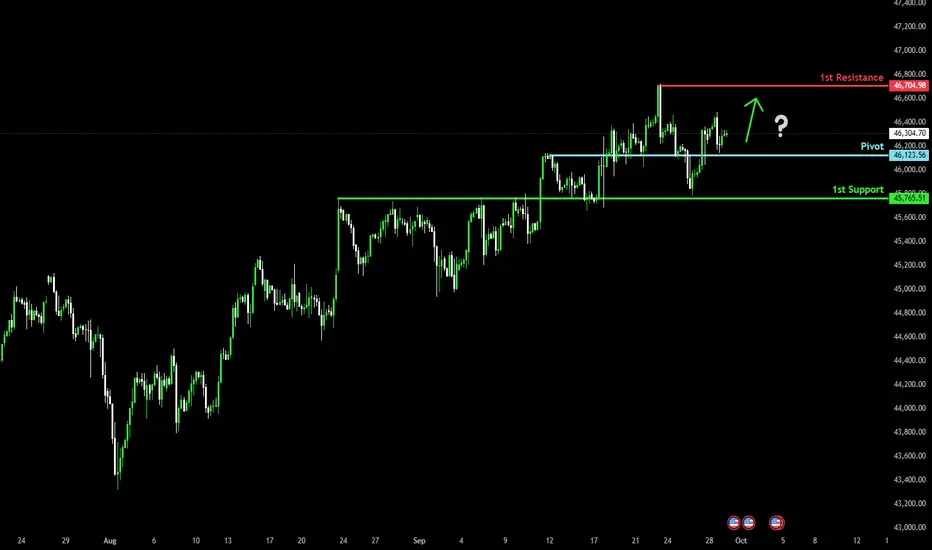
Bullish momentum to extend?Dow Jones (US30) has bounced off the pivot which has been identified as an overlap support and could bounce to the 1st resistance which is a swing high resistance.
Pivot: 46,123.56
1st Support: 45,765.51
1st Resistance: 56,704.98
Disclaimer:
The above opinions given constitute general market commentary, and do not constitute the opinion or advice of IC Markets or any form of personal or investment advice.
Any opinions, news, research, analyses, prices, other information, or links to third-party sites contained on this website are provided on an "as-is" basis, are intended only to be informative, is not an advice nor a recommendation, nor research, or a record of our trading prices, or an offer of, or solicitation for a transaction in any financial instrument and thus should not be treated as such. The information provided does not involve any specific investment objectives, financial situation and needs of any specific person who may receive it. Please be aware, that past performance is not a reliable indicator of future performance and/or results. Past Performance or Forward-looking scenarios based upon the reasonable beliefs of the third-party provider are not a guarantee of future performance. Actual results may differ materially from those anticipated in forward-looking or past performance statements. IC Markets makes no representation or warranty and assumes no liability as to the accuracy or completeness of the information provided, nor any loss arising from any investment based on a recommendation, forecast or any information supplied by any third-party.
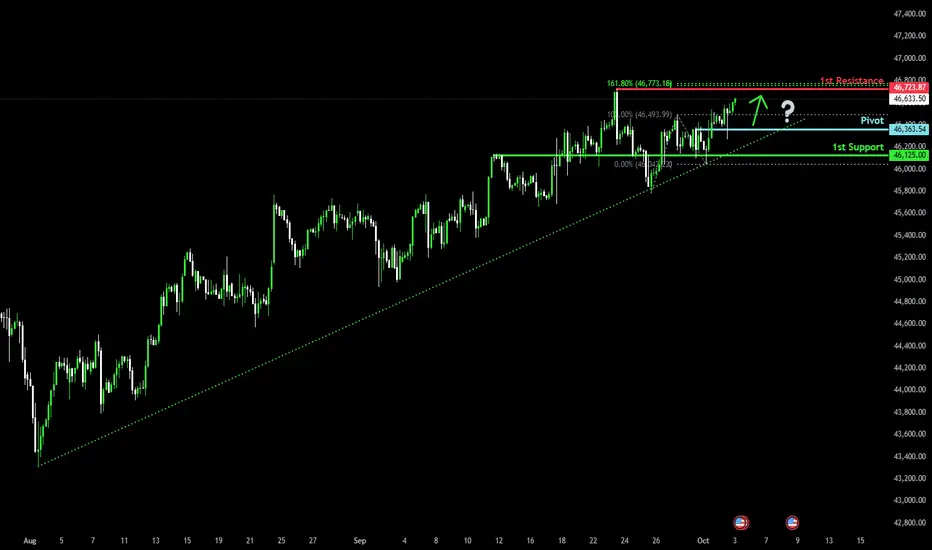
Bullish momentum to extend?Dow Jones (US30) has bounced off the pivot and could rise to the 1st resistance whch acts as a swing high resistance.
Pivot: 46,363.54
1st Support: 46,125
1st Resistance: 46,723.87
Disclaimer:
The above opinions given constitute general market commentary, and do not constitute the opinion or advice of IC Markets or any form of personal or investment advice.
Any opinions, news, research, analyses, prices, other information, or links to third-party sites contained on this website are provided on an "as-is" basis, are intended only to be informative, is not an advice nor a recommendation, nor research, or a record of our trading prices, or an offer of, or solicitation for a transaction in any financial instrument and thus should not be treated as such. The information provided does not involve any specific investment objectives, financial situation and needs of any specific person who may receive it. Please be aware, that past performance is not a reliable indicator of future performance and/or results. Past Performance or Forward-looking scenarios based upon the reasonable beliefs of the third-party provider are not a guarantee of future performance. Actual results may differ materially from those anticipated in forward-looking or past performance statements. IC Markets makes no representation or warranty and assumes no liability as to the accuracy or completeness of the information provided, nor any loss arising from any investment based on a recommendation, forecast or any information supplied by any third-party.
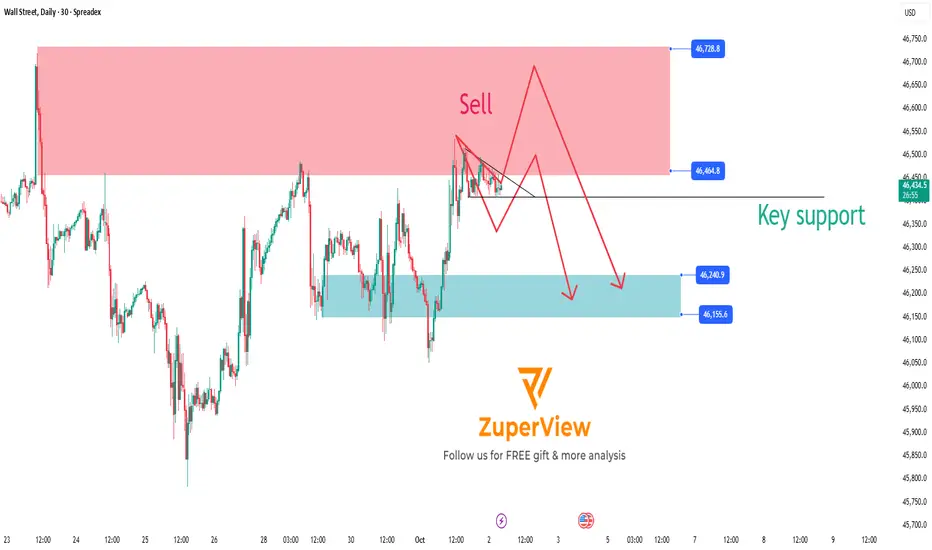
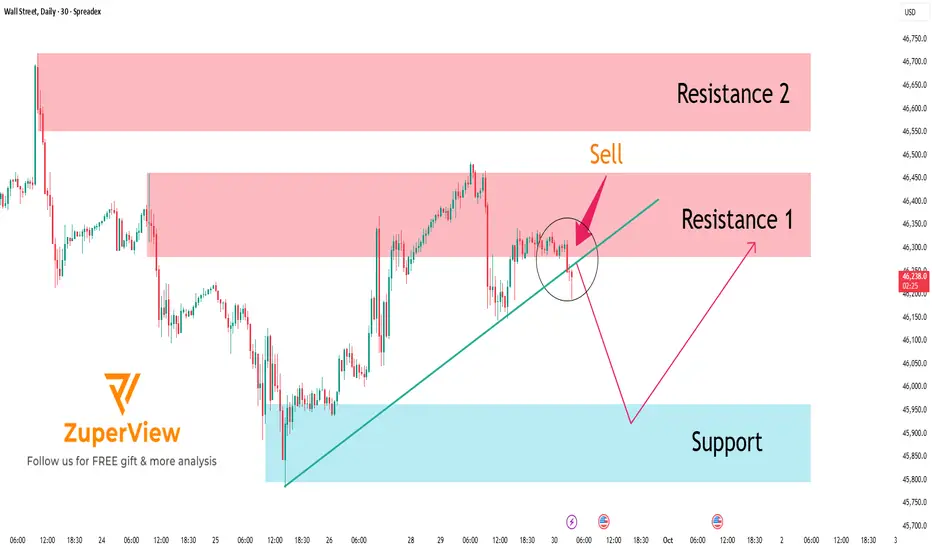
US30: Key support breakdown signals potential sell opportunity
1. Current Market Overview 🌐
The SPREADEX:DJI index is approaching a significant resistance zone where selling pressure is expected to be strong. The price is currently consolidating and moving sideways around this area, preparing for a major move.
2. Technical Signals and Momentum Indicators 📊
Momentum indicators such as MFI, RSI, and Stochastic have all entered the oversold territory, while also showing signs of price compression (consolidation), indicating the market is waiting for the next breakout.
The strong resistance zone and the Overbought/Overextended (OB/OS) signals suggest that buying pressure is weakening, which is favorable for sellers.
3. Sell Scenario on Key Support Breakdown 🔻
If the price breaks below the important Key Support level shown on the chart, this will confirm the beginning of a downtrend.
Traders can consider opening sell positions as soon as the breakout occurs to take advantage of the downward momentum.
The price target is expected to move toward lower support zones where buying interest may emerge to cause a price correction.
4. Risk Management ⚠️
Place stop-loss orders above the resistance zone or the nearest recent highs to protect against unexpected market moves.
Adjust your position size according to your risk tolerance.
5. Conclusion 🔑
The sell setup on US30 is very clear with a strong resistance zone and momentum signals indicating a potential upcoming downtrend.
Main scenario: Breaking the Key Support will trigger a strong decline, providing a profitable trading opportunity for sellers.
Wait for a confirmed support break before entering the trade to ensure safety and effectiveness.
Please like and comment below to support our traders. Your reactions will motivate us to do more analysis in the future 🙏✨
Harry Andrew @ ZuperView
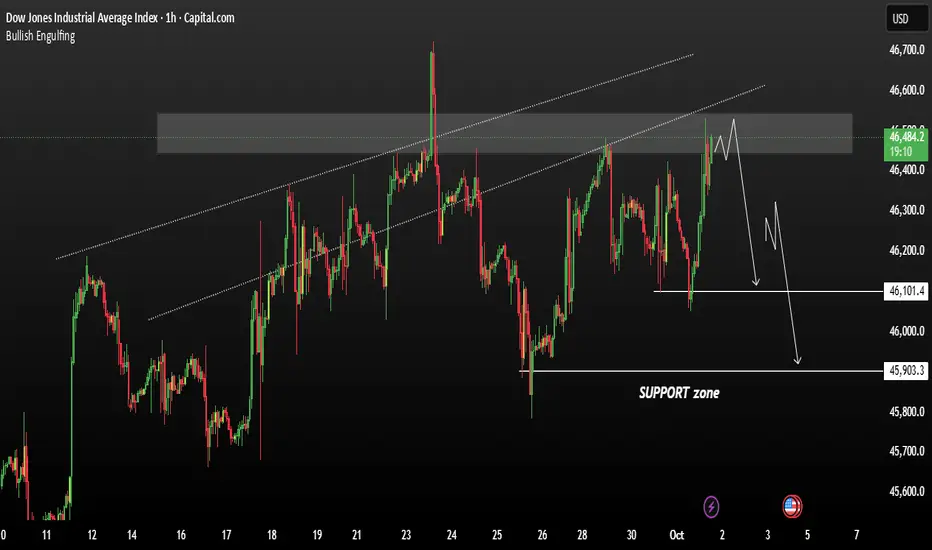
US30 currently consolidating near a key resistance zone US30 is currently consolidating near a key resistance zone likely around the yearly high / major supply level. This resistance has already been tested once previously, where price reversed downward sharply — showing sellers are active here The current sideways movement suggests the market is indecisive or absorbing liquidity before a larger move. If bearish momentum builds, potential support zone we could expect downside target 46,100 – 45,900 falling Range.
You may Find more details in the chart.
Trade wisely Best Of Luck.
Ps. Support with like and comments for better analysis Thanks for Supporting.
check the trend It is expected that the correction process at the specified support levels will end and then we will witness a change in trend.
If the support range is broken, the continuation of the downward trend is likely.
US30 buy order (5.72 RR)
Even though price did make a lower high , it has a higher low and when when price will reaches my order it means that bulls will be in charge of the market
Bullish price action will be validated when price reaches my level (higher highs , higher lows)
I will be targeting the new high made on Tuesday
Price went on a 2 day selloff after the new high
I have been waiting all week long for a trade (distracting myself with stocks ideas, need to stay in my jurisdiction)
The only clear setup I have seen this week
Price is creating a higher low on the 4h
Canceling order if price closes below 45 842.6 before triggering my order

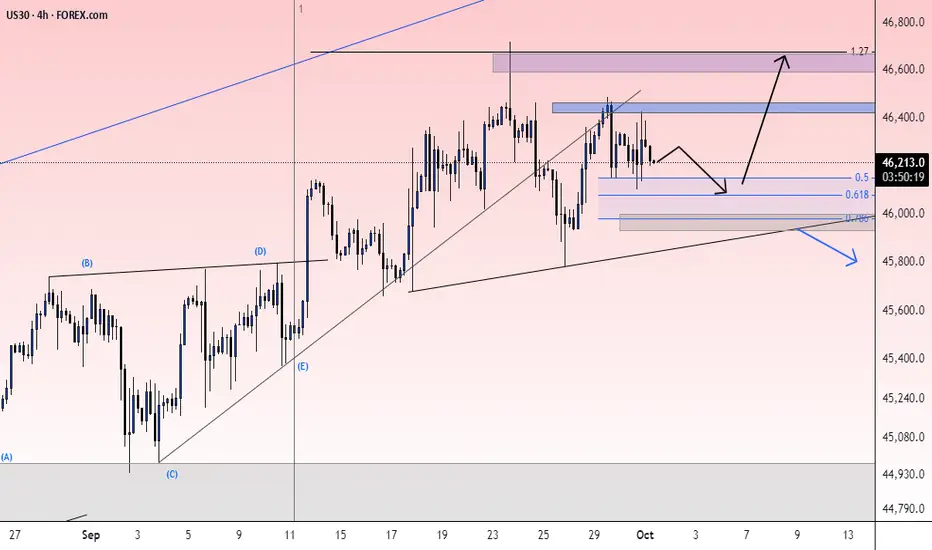
US 30 TRADE IDEA 29 SEPTEMBER 2025 The US30 remains in a clear uptrend, supported by both fundamentals and technicals, so the preferred strategy is to buy dips rather than chase price at current highs. Fundamentally, the backdrop favors equities as the Fed has already started easing with rate cuts, GDP growth remains firm at 3.8%, and inflation is sticky but not spiraling, which keeps the door open for further monetary support. From a price action and SMC perspective, the index is trading near the top of its ascending channel, so the best opportunity is to wait for corrective pullbacks into demand zones where institutional buying is likely to step back in. The primary buy zone is between 45,860 and 45,670, which aligns with recent order blocks and imbalances, and a secondary deeper zone lies near 45,015 if volatility increases. The trade plan is to enter longs around these levels with stops placed below 45,500 to protect against a deeper sweep, while targeting a return to recent highs at 46,400 and an eventual extension toward 47,000–47,500. If instead price breaks cleanly above 46,500 with strong momentum, a breakout-and-retest setup provides another long entry on a pullback to 46,300–46,400, with stops below 46,000 and targets around 47,200–47,800. Overall, the bias is firmly bullish, and the strategy is to position for continuation higher by buying dips into demand or confirmed breakouts, always managing risk with partial profits and trailing stops as price advances.
US30 -Bullish Bias🔹 Pair: US30
🔹 HTF Overview: Structure bullish; market momentum favors the upside.
🔹 MTF Outlook: Waiting for a deep sweep of stop-losses (SSL) to refine continuation setup.
🔹 LTF Setup: Once SSL is taken, drop to lower timeframe for CHoCH confirmation and precise entries.
🔹 Targets: Mid- to long-term highs, aligned with bullish structure and liquidity zones.
🔹 Mindset Note: Patience is key—let smart money lead before committing.

To you in comment…Us30…
FYI…. How far I’m willing to take it. 👀
Let’s get it!!!
Ny active!!!!
Bag or Dust 🏦

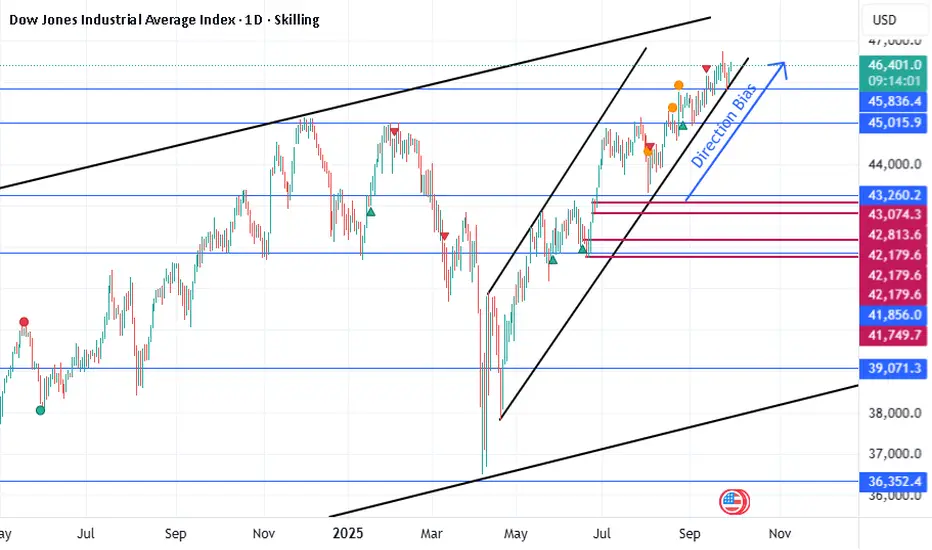
DJI Holy sh!% Bubble, 2028Just an idea I was playing around with, Dow Jones on this long parabolic move and the resulting crash wIll be fantastically devastating for the american people, again.

us30I don’t usually trade US30, but price action is clear enough for me to read. Looks like a solid buy setup.
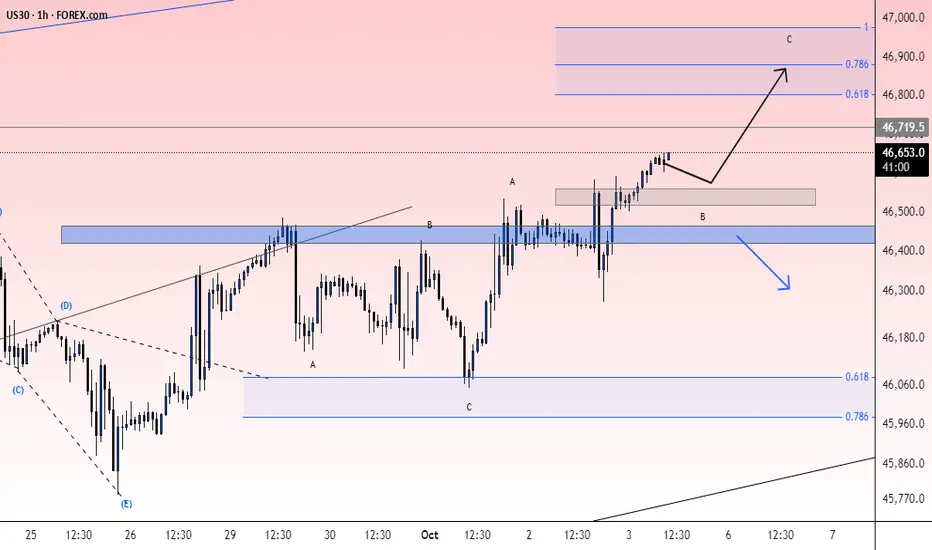
Is the Dow Jones still bullish? Yes.
Hello everyone
I think Dow Jones has the potential to grow further and if the conditions set in the figure below are met, it can be said that it can easily reach the set target. What do you think, friend? Leave me a comment

US30: Rejects Resistance – Bearish Move in Progress
The SPREADEX:DJI index is currently forming a bearish short-term structure, especially after price entered the Resistance Zone 1 (46,279 – 46,445) — a key area where sellers have clearly stepped in with strong rejection.
🚨 CLEAR REVERSAL SIGNALS
At Resistance 1, we saw multiple rejection candles with strong bearish bodies.
Additionally, the MA Plot has turned downward, signaling a possible shift in trend.
Price also touched the 4-level structure zone of support/resistance, adding confluence to the area.
Immediately after, the market reversed and dropped sharply with strong bearish candles, confirming the presence of selling pressure and strengthening the short bias.
📉 PREFERRED SCENARIO – SHORT WITH THE TREND
With the current momentum, the preferred scenario is:
🔻 Price is likely to continue dropping toward the Support Zone: 45,459 – 45,798
This zone serves as a logical short-term target for any short positions taken at Resistance 1. Once price reaches this area, traders can consider partial or full take-profits, depending on market reaction.
🧠 TRADE IDEA
Action: 🔻 Short
Entry Zone: 46,279 – 46,445
Stop Loss: Above 46,550
Take Profit: 45,800 – 45,500
✅ CONCLUSION
US30 is under visible selling pressure after rejecting Resistance 1 and reacting strongly at multiple confluence levels. The technical setup favors a trend-following short strategy, with proper risk management and patience around key levels to confirm next moves.
Please like and comment to support our traders. Your feedback motivates us to produce more analysis in the future 🙏✨
$us30Dirty 30….
She’s hunting $46,900+
Layered in as and willing to go $46,606 which holds key to pricing a long or short!!!
Let’s get it!!!!
