IS IT A VALID BREAKOUT RIGHT NOW?Broken strong uptrend is a sign of the bull trend has ended.
I would SELL with SL on the ATH and see how low the bear could go.
CHEEERRRSSS..!!!
Trade ideas

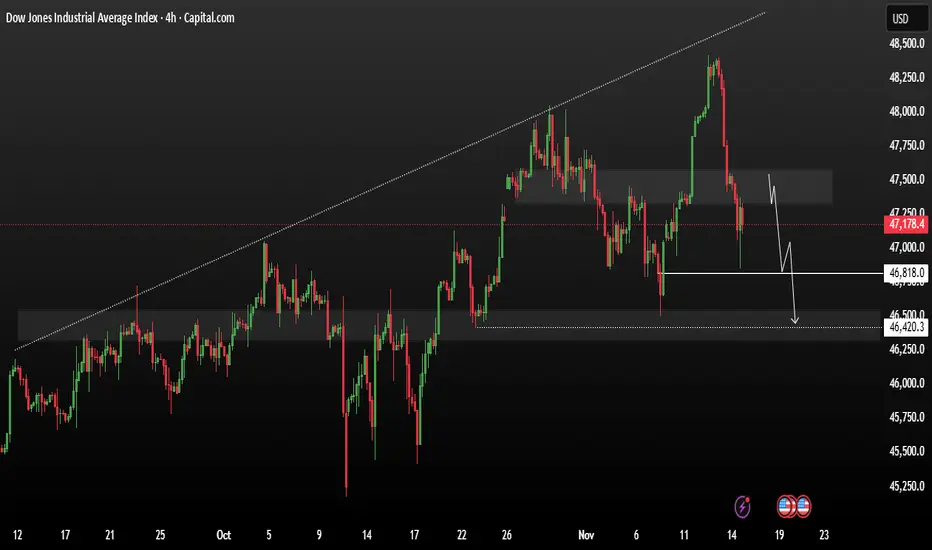
US30 remains in a bearish trend toward support levels.US30 remains in a bearish trend. The price may first retest a resistance zone, but unless there is a confirmed bullish breakout, the expectation is for another decline toward support levels.
From a market sentiment perspective, U.S. indices closed mixed on Friday as investors look ahead to Nvidia’s upcoming earnings release next week and remain cautious due to concerns that the Federal Reserve may delay cutting interest rates in December.
If price fails to hold above 47,500 and closes below resistance and price move to downside and there potentially target point will be 46,818 to 46,420
You may find more details in the chart,
Trade wisely best of Luck.
Ps; Support with like and comments for better analysis Thanks for Supporting.
#DJI - 1500 Point Move on Cards?Date: 13-11-2025
#DJI Current Price: $48,254.83
Pivot Point: $48,160.50 Support: $47,650.55 Resistance: $48,673.16
Upside Levels:
L1: $48,957.83 L2: $49,242.50 L3: $49,648.25 L4: $50,054.00
Downside Levels:
L1: $47,364.53 L2: $47,078.50 L3: $46,672.75 L4: $46,267.00
#Tradingview #DJI #NDX #NIFTY #BTC #GOLD

Dow At The End Of The TrendDow Jones Index has been showing us negative divergences both on the monthly and weekly charts. Macd on the weekly has crossed downwards. Everybody is talking about Berkshire Hathaway buying Google stocks but overlook the fact that they have been selling Bank of America. The reason why they have been selling BAC is not something I can answer. All I can see is that the technicals show weakness and we are at the edge of a 3 leg downtrend.

US30 Trade Set Up Nov 18 2025Price is showing strong bearish movement, creating LL/LH on the 1h and 15m and has BOS on the 15m so first id want to see price sweep internal BSL and tap into 15m or 1h FVG before looking for a continuation back down to lower SSL and 4h FVG

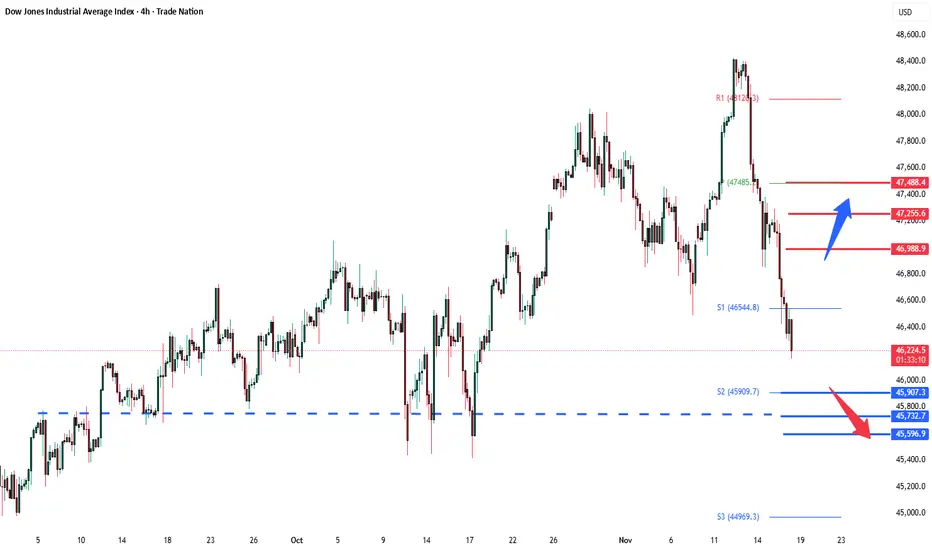
DowJones Key Trading LevelsKey Support and Resistance Levels
Resistance Level 1: 46988
Resistance Level 2: 47255
Resistance Level 3: 47488
Support Level 1: 45907
Support Level 2: 45732
Support Level 3: 45600
This communication is for informational purposes only and should not be viewed as any form of recommendation as to a particular course of action or as investment advice. It is not intended as an offer or solicitation for the purchase or sale of any financial instrument or as an official confirmation of any transaction. Opinions, estimates and assumptions expressed herein are made as of the date of this communication and are subject to change without notice. This communication has been prepared based upon information, including market prices, data and other information, believed to be reliable; however, Trade Nation does not warrant its completeness or accuracy. All market prices and market data contained in or attached to this communication are indicative and subject to change without notice.
us30 bullishDow Jones can start its bullish move from 46,411 toward 46,681, keeping in mind the critical level at 46,298. CMCMARKETS:US30

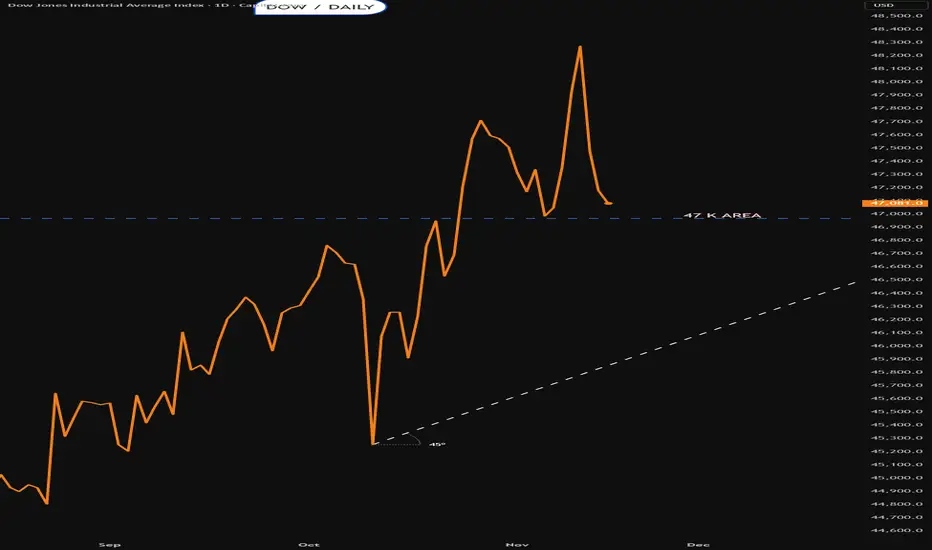
DJI : The 50-Day MA Line in the SandThe Dow Jones Industrial Average (DJI) is undergoing its most significant technical test in the current market cycle, finding itself right at the doorstep of the pivotal 50-Day Moving Average (MA). This level has been a key area for bulls to defend, and its failure to hold has historically signaled a shift in short-to-medium-term momentum.
1. 🔨 Technical Outlook: The 45,000 Threat
The 50-Day MA is the line in the sand for the short-to-medium-term trend.
Failure Condition (The Trigger): A decisive Daily candle close BELOW the 50-Day MA would invalidate the current structural uptrend and confirm a shift to bearish momentum.
Bearish Target (The Deep Crash): If the 50D MA is lost, selling pressure is likely to accelerate as stop-losses are triggered. The next major, high-probability structural support zone is the 45,000 pivot. This level aligns with critical prior consolidation and would mark a significant technical correction.
Bullish Case: A successful rejection and bounce from the 50D MA (e.g., a strong bullish reversal candle) would confirm the support and keep the focus on re-testing the recent highs in the $47,500 - $48,000 range.
2. 🌐 Fundamental Outlook: A Looming Slowdown
While corporate earnings for the Dow components have been resilient, macro and policy risks suggest the bullish fundamental tailwinds are weakening, which could easily amplify a technical breakdown.
The primary headwind is the increasing monetary policy uncertainty from the Federal Reserve; while the market had priced in a clear path of rate cuts, recent economic resilience and sticky inflation have raised doubts, increasing the risk of a "higher-for-longer" scenario. This elevates borrowing costs for the Dow's industrial and financial components and places pressure on corporate valuations. Furthermore, geopolitical and trade policy risks, including the cost impact of new tariffs and regulatory uncertainty, are expected to squeeze corporate profit margins and act as a drag on global business sentiment. Although domestic consumer spending has shown resilience, a persistent slowdown in global growth and a moderation of U.S. GDP forecasts suggest that the earnings momentum required to sustain current high valuations may be fading, fundamentally supporting a corrective move if the 50-Day MA fails to hold.
📢📢📢
If my perspective changes or if I gather additional fundamental data that influences my views, I will provide updates accordingly.
Thank you for following along with this journey, and I remain committed to sharing insights and updates as my trading strategy evolves. As always, please feel free to reach out with any questions or comments.
Other posts related to this particular position and scrip, if any, will be attached underneath. Do check those out too.
Disclaimer : The analysis shared here is for informational purposes only and should not be considered as financial advice. Trading in all markets carries inherent risks, and past performance is not indicative of future results. It’s essential to conduct your own research and assess your risk tolerance before making any investment decisions. The views expressed in this analysis are solely mine. It’s important to note that I am not a SEBI registered analyst, so the analysis provided does not constitute formal investment advice under SEBI regulations.

Dow Jones - Looking To Sell Pullbacks In The Short TermH1 - Strong bearish move.
No opposite signs.
Expecting bearish continuation until the two Fibonacci resistance zones hold.
If you enjoy this idea, don’t forget to LIKE 👍, FOLLOW ✅, SHARE 🙌, and COMMENT ✍! Drop your thoughts and charts below to keep the discussion going. Your support helps keep this content free and reach more people! 🚀
-------------------------------------------------------------------------------------------------------------------

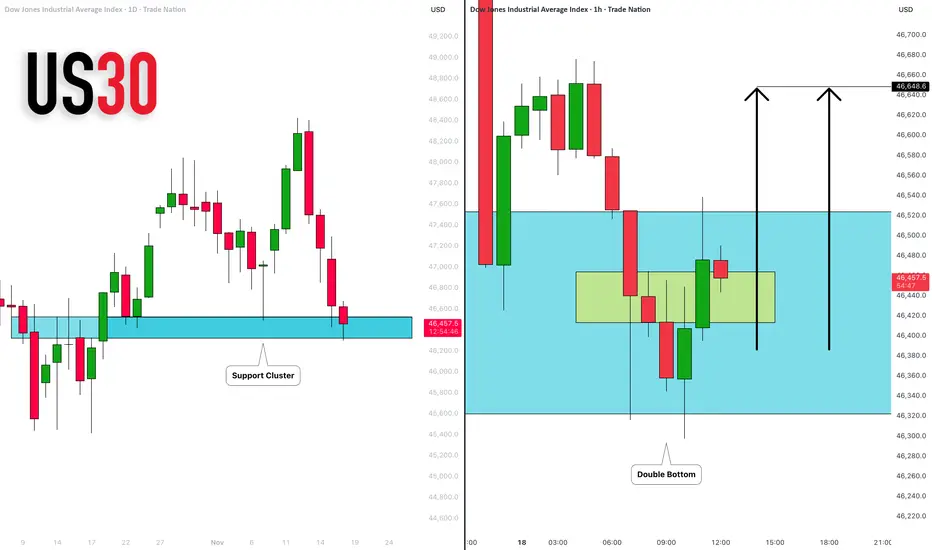
DOW JONES INDEX (US30): Time to Buy?!
It feels like US30 has finally found a bottom.
I see a strong buying interest after a test of a key
historic support cluster.
I anticipate a pullback at least to 46648
❤️Please, support my work with like, thank you!❤️
I am part of Trade Nation's Influencer program and receive a monthly fee for using their TradingView charts in my analysis.
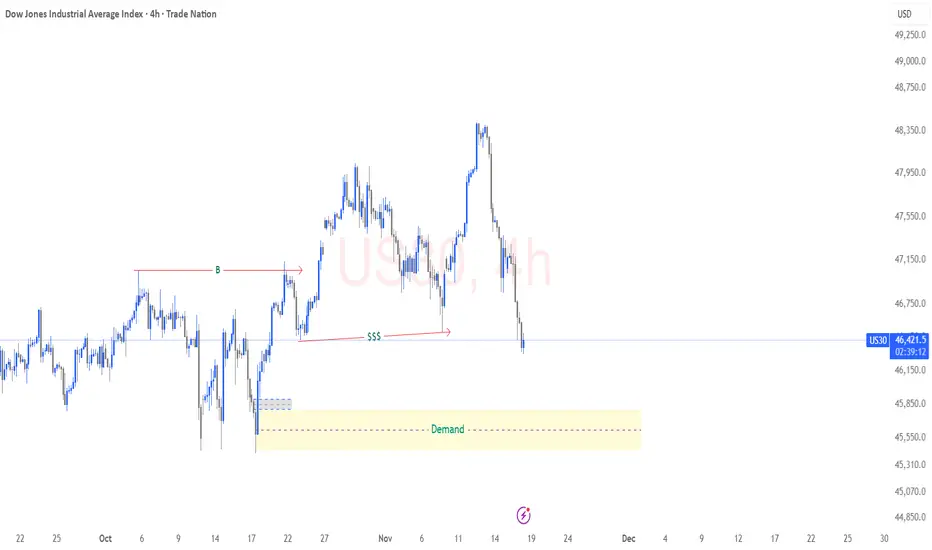
US30 – Potential Buy Setup into Higher-Timeframe Demand 4HPrice has already printed a Break of Structure (BOS), confirming bullish order flow on the 4H timeframe. The current sell-off is corrective, not a trend reversal. As price retraces, it sweeps internal liquidity (SSS) and taps into a strong 4H demand zone – the same zone that caused the BOS.
This area offers discounted pricing for a potential continuation of the bullish move. If lower-timeframe confirmations appear inside the demand zone, we can expect price to rotate upward and target the imbalance and highs left above.
A value-driven buy: wait for confirmation, then aim for bullish continuation in line with the structural bias.
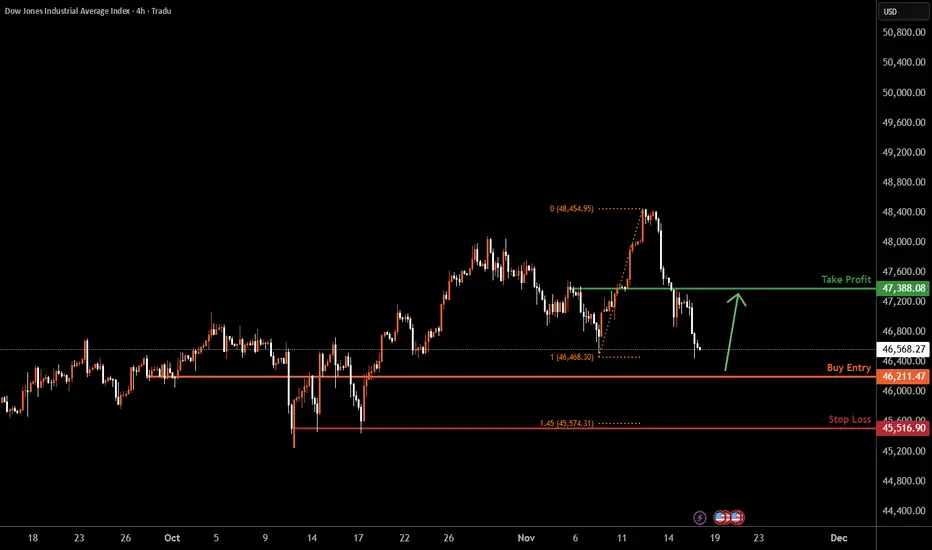
US30 H4 | Bullish Reversal SetupMomentum: Bullish
The price is currently retracing toward the buy entry, which aligns with a key pullback support level.
Buy Entry: 46,211.47
Pullback support
Stop Loss: 45,516.00
Multi swing-low support
145% Fibonacci extension
Take Profit: 47,388.08
Pullback resistance
High Risk Investment Warning
Stratos Markets Limited (tradu.com ), Stratos Europe Ltd (tradu.com ):
CFDs are complex instruments and come with a high risk of losing money rapidly due to leverage. 70% of retail investor accounts lose money when trading CFDs with this provider. You should consider whether you understand how CFDs work and whether you can afford to take the high risk of losing your money.
Stratos Global LLC (tradu.com ): Losses can exceed deposits.
Please be advised that the information presented on TradingView is provided to Tradu (‘Company’, ‘we’) by a third-party provider (‘TFA Global Pte Ltd’). Please be reminded that you are solely responsible for the trading decisions on your account. Any information and/or content is intended entirely for research, educational and informational purposes only and does not constitute investment or consultation advice or investment strategy. The information is not tailored to the investment needs of any specific person and therefore does not involve a consideration of any of the investment objectives, financial situation or needs of any viewer that may receive it. Past performance is not a reliable indicator of future results. Actual results may differ materially from those anticipated in forward-looking or past performance statements. We assume no liability as to the accuracy or completeness of any of the information and/or content provided herein and the Company cannot be held responsible for any omission, mistake nor for any loss or damage including without limitation to any loss of profit which may arise from reliance on any information supplied by TFA Global Pte Ltd.
US30Sales option and also purchases, it is not investment advice but it looks interesting. wait for confirmation patterns in 30 minutes

US30 FREE SIGNAL|LONG|
✅US30 taps a key demand zone after a clean liquidity sweep, signaling potential displacement higher. If bullish orderflow sustains, a premium retracement toward the target zone is likely.
—————————
Entry: 46,590
Stop Loss: 46,408
Take Profit: 46,808
Time Frame: 4H
—————————
LONG🚀
✅Like and subscribe to never miss a new idea!✅

Seems like dow is continue to fall. NYSE:DOW dow is weak now. broke the previous swing and seems like it is going to continue its trajectory and keep falling.

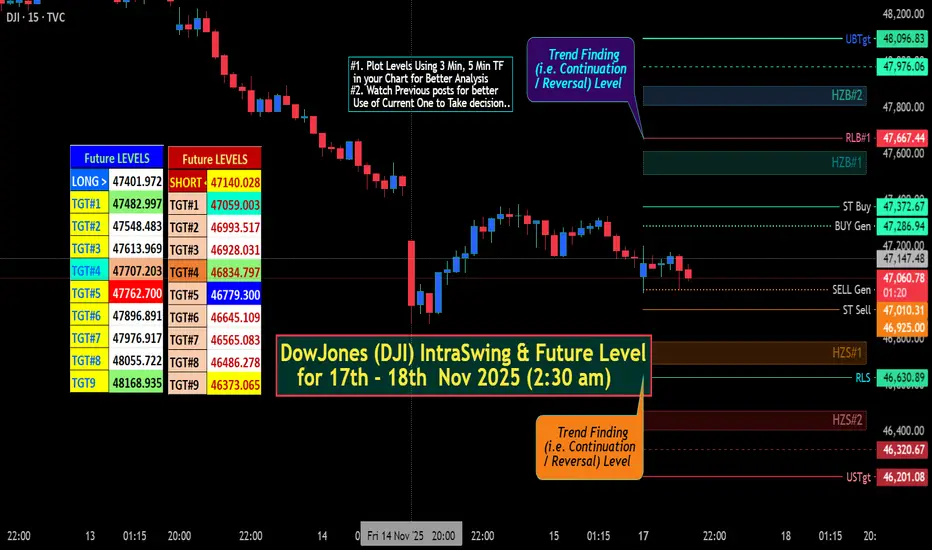
DowJones (DJI) IntraSwing & Future Level for 17th - 18th Nov 25✍🏼️ "Future IntraSwing Levels" mentioned in BOX format.
Useful to Tally / Recognize for Next day Trade Plan.
[ Level Interpretation / description:
L#1: If the candle crossed & stays above the “Buy Gen”, it is treated / considered as Bullish bias.
L#2: Possibility / Probability of REVERSAL near RLB#1 & UBTgt
L#3: If the candle stays above “Sell Gen” but below “Buy Gen”, it is treated / considered as Sidewise. Aggressive Traders can take Long position near “Sell Gen” either retesting or crossed from Below & vice-versa i.e. can take Short position near “Buy Gen” either retesting or crossed downward from Above.
L#4: If the candle crossed & stays below the “Sell Gen”, it is treated / considered a Bearish bias.
L#5: Possibility / Probability of REVERSAL near RLS#1 & USTgt
HZB (Buy side) & HZS (Sell side) => Hurdle Zone,
*** Specialty of “HZB#1, HZB#2 HZS#1 & HZS#2” is Sidewise (behaviour in Nature)
Rest Plotted and Mentioned on Chart
Color code Used:
Green =. Positive bias.
Red =. Negative bias.
RED in Between Green means Trend Finder / Momentum Change
/ CYCLE Change and Vice Versa.
Notice One thing: HOW LEVELS are Working.
Use any Momentum Indicator / Oscillator or as you "USED to" to Take entry.
⚠️ DISCLAIMER:
The information, views, and ideas shared here are purely for educational and informational purposes only. They are not intended as investment advice or a recommendation to buy, sell, or hold any financial instruments. I am not a SEBI-registered financial adviser.
Trading and investing in the stock market involves risk, and you should do your own research and analysis. You are solely responsible for any decisions made based on this research.
"As HARD EARNED MONEY IS YOUR's, So DECISION SHOULD HAVE TO BE YOUR's".
Do comment if Helpful .
In depth Analysis will be added later (If time Permits)
US30 Price ActionReasons for Long
1. Trend Bullish
2. Pattern - Inverted H&S
3. Structure - HH & HL
4. RR: 8R+
Alternative probabilities
1. Price can hunt stop loss from recent swings & give traget after stop loss hunt


Dow into the open Monday 17th NovemeberLets see if it can hold that pivot area
Poss bear traps below
Lets see
US30 Trade Set Up Nov 17 2025Price has left a daily FVG that will need to be filled this week but first i want to see a sweep of SSL or PDL followed by internal 1m-5m IFVG/CISD to target BSL

US30 Technical Breakdown – 11/17/2025📍 US30 Technical Breakdown – 11/17/2025
US30 rejected the 47,400–47,450 resistance zone, forming a clean lower high as bearish momentum starts to build. After failing to reclaim the EMA cluster, price is now heading back toward the 47,100–47,000 structure zone — a key level that determines whether downside continues or buyers step in again 👀📉.
📊 Market Behavior:
🔹 Clear rejection from the 47,450 supply zone
🔹 EMAs crossing bearish → momentum shifting downward
🔹 Lower-high structure forming → sellers gaining control
📌 Key Levels:
🔹 Resistance:
47,450 → major intraday supply / rejection point
47,300 → EMA cluster + bearish retest zone
🔹 Support:
47,111 → first bounce zone
47,000 → structural support / psychological level
46,519 → deeper demand zone
🧠 Bias:
Bearish pressure building 📉
⬇️ Break below 47,111 → opens the move toward 47,000–46,850
⬆️ Reclaim of 47,300+ → shifts momentum back to neutral

Bull US30We have the HL arround price level 46,952 created from last week correction. So price maintains its bull structure.
But we still have a resistance level around 47,298 . If price breaks through our bullish trade will be activated.
Let's keep an eye on any high impact news.

US30 LongsBias: Bullish continuation, but with caution given proximity to resistance.
Setup: If price breaks cleanly above the resistance zone with momentum (i.e., a strong bullish candle, minimal wick, decent follow-through) then a long entry is justified. Entry could be placed just above the breakout candle high.
Alternative: If price rejects the resistance zone (e.g., bearish pin bar, engulfing candle, then broken trendline) then a short counter-trend trade might be viable — but only for experienced traders with tight risk control, because the broader trend is still up.
Stop-loss: For the long trade, consider placing a stop just below the breakout candle low or below the trendline pivot, whichever is tighter. For the short trade, a stop above the recent swing high/resistance zone.
Target: For the long trade, the next logical target is the next major supply area (perhaps historical highs or measured move from the consolidation). For the short trade, target near the trendline support or prior swing lows.
The chart shows a clear uptrend over the intermediate term, with a series of higher highs and higher lows.
Price has respected key structure zones (off the weekly and daily frames) and is now approaching a significant resistance region.
Volume data is not shown, but the price action suggests momentum has been backing this move (i.e., relatively strong candles, visible follow-through after retests).
