Review of USOIL's Performance This Week📝This week, the USOil market exhibited a highly volatile pattern of "first bottoming out and stabilizing, then rebounding driven by geopolitical factors". The competition between supply-demand fundamentals and sudden geopolitical events dominated the market trend throughout the week. Details are as follows:
💡Price Movement: From Approaching Annual Lows to Intraday Surges, Volatility Within Ranges Intensifies
1. Bottoming Out Early in the Week
On Monday, USOil continued its weak oscillation. It opened at $57.32 per barrel, dipped to a low of around $56 per barrel (approaching the 2025 annual low of $55.12), and finally closed at $56.93 per barrel, down $0.61 from the previous trading day.
From Tuesday to Wednesday, as panic eased, prices gradually stabilized and rebounded. It closed at $57.58 per barrel on Tuesday; on Wednesday, boosted by geopolitical expectations, it surged by $3.25 in a single day to close at $61.75 per barrel, with trading volume rising to 711,600 lots.
2. Rebounding and Then Retreating in the Latter Half of the Week
On Thursday, the official release of detailed EU and U.S. sanctions on Russian energy triggered a strong market reaction. USOil opened at $59.94 per barrel and then jumped, peaking at $62.59 per barrel with an intraday gain of nearly 5%, before closing at $61.44 per barrel.
On Friday, after the earlier rebound, prices entered a consolidation phase, fluctuating narrowly around $62. For the whole week, it rebounded by over 10% from the previous week’s low.
💡Core Influencing Factors:
1. Bearish Drivers: Sustained Supply-Demand Easing Suppresses Oil Prices
✔Worsening Supply Glut
✔Weak Demand Weighs on Prices
2. Bullish Disturbances: Geopolitical Sanctions Trigger a Phased Rebo
💡Technicals and Market Sentiment: Recovery After Oversold Conditions, Persistent Long-Short Divisions
1. Divergent Signals from Technical Indicators
2. Intense Battles Around Key Levels
The support at the annual low of $55.12 proved effective, serving as the starting point for the week’s bottoming and rebound. The resistance levels at $58 and $62 were breached one after another, but the resistance from the $63 level and the 70-dollar trend line still posed long-term pressure. A breakthrough would require sustained improvement in fundamental
💡Outlook: Short-Term Oscillations Unlikely to Reverse Long-Term Weak Trend
💎Short-Term Perspective: Geopolitical risk premiums and technical recovery after oversold conditions may support oil prices to fluctuate within the $58-$63 range. If the supply gap caused by sanctions continues to widen, it may test the resistance level of $66.
💎Long-Term Perspective: The IEA predicts that Brent crude oil prices will range between $52-$60 in 2026. Core contradictions such as loose supply-demand, accelerated energy transition, and approaching demand peaks remain unresolved. If the support at $55 is broken, it may fall to the deep correction range of $49 or even $37.
The market should focus on whether OPEC+ will adjust its production increase plan at the November 2 meeting and the impact of global manufacturing PMI data on demand expectations.
Trade ideas
Upward trend in oilThe price of very clean oil reacted to the specified range and started an upward trend. We expect either the upward trend to continue or the price to correct and resume its upward movement from the specified range.

Today's crude oil strategy, hoping to be helpful to you.Although the current broader context of the international crude oil market is "excess supply and weak demand", from the perspective of short-term and potential opportunities, there are three key points that support us to attempt a long position. We should not be deterred by the broader "weak market" trend:
Potential "Flashpoints" in Geopolitical Conflicts
Ukraine has not stopped using drones to attack Russia's oil facilities, and Russia's oil refining volume has now hit its lowest level in over two years. If key pipelines are attacked next, or if conflicts between Israel and Qatar in the Middle East escalate further, affecting crude oil transportation, the market will definitely rush to buy oil out of panic. In this case, oil prices will most likely surge suddenly. For example, back in June, when Israel launched an air strike on Iran's nuclear facilities, oil prices rose by 6.9% in a single day. We must seize such opportunities.
Possible "Hitches" in OPEC+ Production Increase
Although OPEC+ plans to increase supply by an additional 137,000 barrels per month in October and November, many oil-producing countries actually have little extra oil to produce. As early as May, the actual production increase was more than half lower than the planned amount. If OPEC+ announces "no more production increases" in subsequent meetings, or even resumes production cuts, the pressure from excess supply will be reduced significantly, and oil prices will naturally be able to hold steady or even rise.
Crude Oil Trading Strategy for Today
usoil @buy 57.50-58.00
pt:58.50-59
sl:57

Bearish reversal off major resistance?WTI Oil (XTI/USD) is rising towards the pivot, which is an overlap resistance and could reverse to the 1st support.
Pivot: 62.10
1st Support: 58.37
1st Resistance: 64.66
Disclaimer:
The above opinions given constitute general market commentary, and do not constitute the opinion or advice of IC Markets or any form of personal or investment advice.
Any opinions, news, research, analyses, prices, other information, or links to third-party sites contained on this website are provided on an "as-is" basis, are intended only to be informative, is not an advice nor a recommendation, nor research, or a record of our trading prices, or an offer of, or solicitation for a transaction in any financial instrument and thus should not be treated as such. The information provided does not involve any specific investment objectives, financial situation and needs of any specific person who may receive it. Please be aware, that past performance is not a reliable indicator of future performance and/or results. Past Performance or Forward-looking scenarios based upon the reasonable beliefs of the third-party provider are not a guarantee of future performance. Actual results may differ materially from those anticipated in forward-looking or past performance statements. IC Markets makes no representation or warranty and assumes no liability as to the accuracy or completeness of the information provided, nor any loss arising from any investment based on a recommendation, forecast or any information supplied by any third-party.

US CREDE OIL SPORTAccording to Wyckoff's analysis, the trend of oil in the Forex market is accumulation and we are starting this change. Please send me your comments.
Thank you, my dear professor Ramtia Siddiqi

USOIL Buyers In Panic! SELL!
My dear subscribers,
This is my opinion on the USOIL next move:
The instrument tests an important psychological level 61.43
Bias - Bearish
Technical Indicators: Supper Trend gives a precise Bearish signal, while Pivot Point HL predicts price changes and potential reversals in the market.
Target - 59.88
About Used Indicators:
On the subsequent day, trading above the pivot point is thought to indicate ongoing bullish sentiment, while trading below the pivot point indicates bearish sentiment.
Disclosure: I am part of Trade Nation's Influencer program and receive a monthly fee for using their TradingView charts in my analysis.
———————————
WISH YOU ALL LUCK

USOIL – Downtrend Still IntactUSOIL remains fundamentally weak with technical confirmation of a prevailing downtrend. Short-term pullbacks are likely corrective and may provide better short-entry setups.
Resistance levels:
59.14
60.36
61.91 (Ultimate)
Support levels:
54.81
53.13
51.95 (Ultimate)

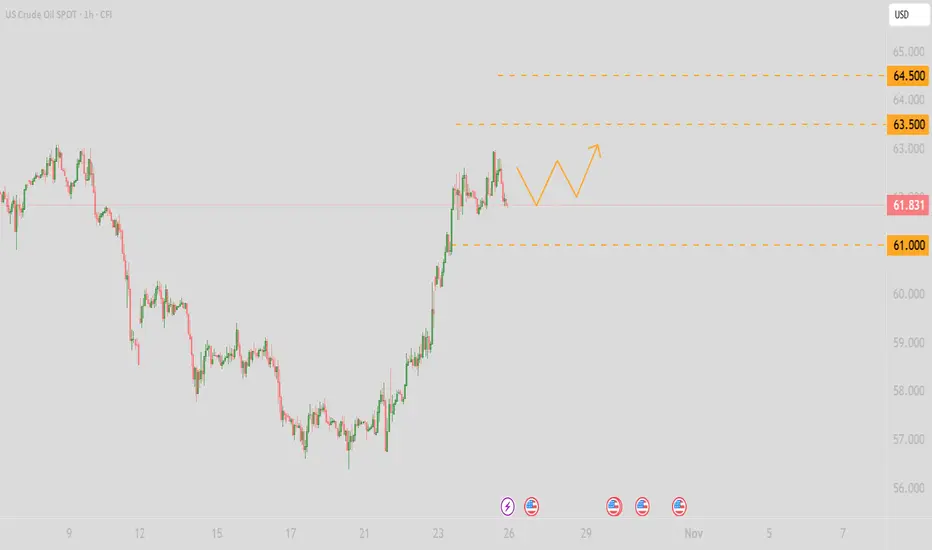
USOIL: Go long on pullbacksGeopolitical risks have dominated short-term market sentiment for crude oil. Investors' concerns about the supply side have overshadowed negative factors on the demand side, driving oil prices to rise consecutively. However, the weak global economy has dimmed the long-term demand outlook, limiting the extent of oil price increases, resulting in relatively complicated overall market sentiment.
From a technical indicator perspective, momentum indicators are showing positive signals, and the MACD is trending upward. This indicates that the bullish bias is strengthening, but a fully established uptrend has not yet formed.
Overall, technical indicators point to a certain bullish tendency, though it is also necessary to monitor the price performance at key resistance levels.
In the short term, focus on the resistance range of 63.5–64.5 on the upside and the support range of 60–61 on the downside. For intraday operations, the main strategy is to go long on pullbacks, with short positions on rebounds as a supplementary approach.
💎Trading Strategy:
Buy 61.8 SL 62.4 TP 61.1
Daily-updated accurate signals are at your disposal. If you run into any problems while trading, these signals serve as a reliable reference—don’t hesitate to use them! I truly hope they bring you significant assistance
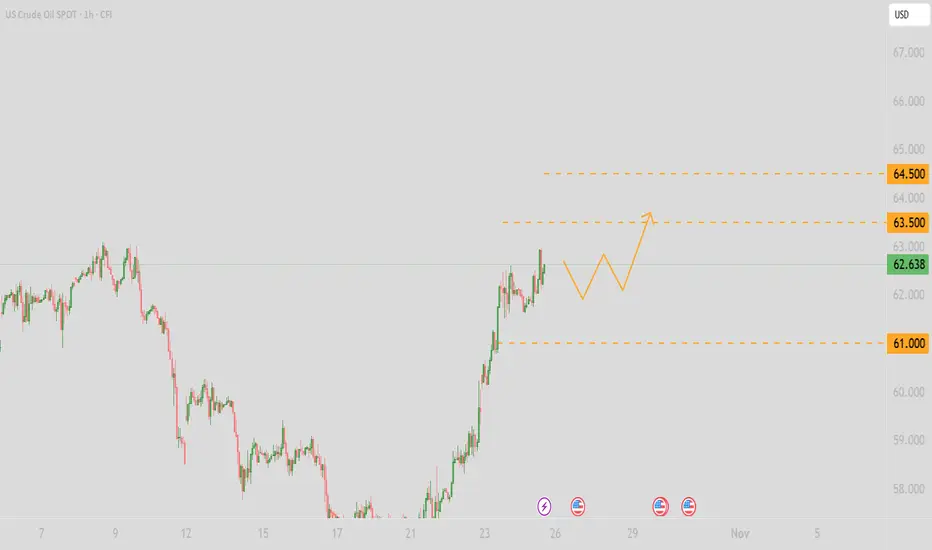
Where Does the Short-Term Confidence for Going Long Come From?Geopolitical Conflicts "Continue to Drive Momentum" – Supply Worries Persist
The U.S. has just imposed sanctions on two major Russian oil giants, which account for 50% of Russia’s crude oil exports. This could mean a daily reduction of 1.5 million barrels in global supply, and the market is worried about "insufficient oil". A prime example: when Ukrainian forces attacked Russian refineries earlier, daily exports dropped by 1 million barrels, and oil prices rose 2% the same day. Now, such sanctions are still escalating, which will firmly support oil prices in the short term and prevent a sharp decline.
Demand Data Offers "Genuine" Positives – Strong Floor Support
U.S. crude oil inventories have decreased by 960,000 barrels, and refinery utilization rate has risen to 88.6% – this clearly shows "more oil is being consumed than produced", so the current price increase is not unfounded. Meanwhile, China’s refinery utilization rate has also climbed from 86% to 88%, and there is a requirement to ensure refined oil supply in the fourth quarter. This means demand for crude oil will only increase, not decrease, adding a "safety cushion" for long positions. Even if there is a short-term pullback, the decline will be very limited.
Crude Oil Trading Strategy for Today
usoil @buy 62.0-62.3
tp:62.5-62.8
sl:61.8
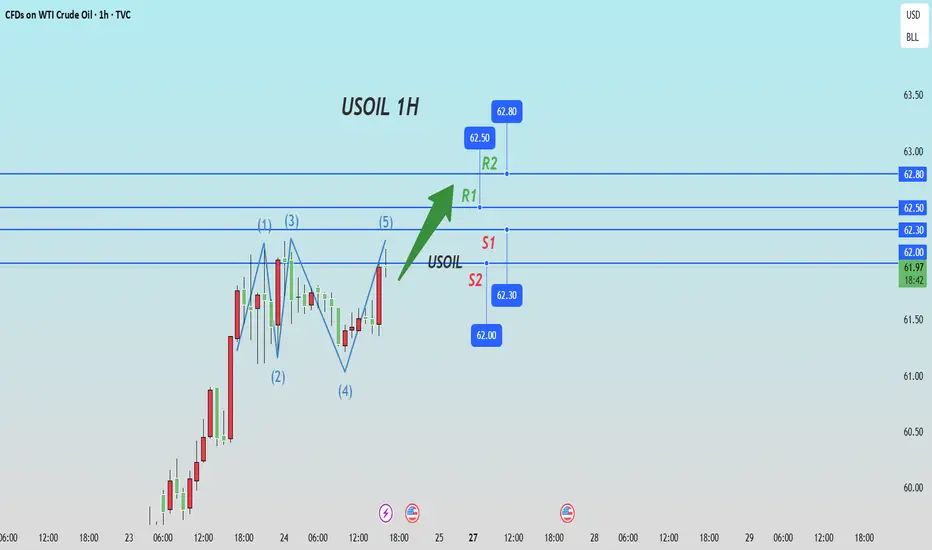
Today's crude oil trading strategyDon't be intimidated by "mid-term supply pressure", as the risks are manageable when going long.
1. Geopolitical Conflicts "Keep Adding Fuel" – Supply Worries Persist
The U.S. has just escalated sanctions on Russia and imposed restrictions on Venezuela’s crude oil exports, which directly cuts off part of the global supply. For context: When Ukrainian forces attacked Russian ports earlier, Russia’s daily crude exports dropped by 2 million barrels, and oil prices jumped 3% in a single day. Now, sanctions like these will only make the market more anxious about "insufficient oil supply," which will keep prices supported in the short term.
2. Inventory Data Offers "Genuine" Positives – Demand Provides a Safety Net
U.S. crude oil inventories have fallen for two consecutive weeks, with a further drop of 1.8 million barrels in the latest week. This clearly shows "more oil is being used than produced" – the current price gains aren’t unfounded. Additionally, China’s refinery utilization rate has risen from 86% to 88%, and there’s a requirement to ensure refined oil supply in the fourth quarter. This means demand for crude oil will only increase, adding an extra "safety cushion" for long positions.
Crude Oil Trading Strategy for Today
usoil @buy60.80-61.0
tp:61.5-62
sl:60

USOILIF OIL bull can break and close 65$ level than oil could rise into 70-75k from the projection.
#usoil #wti


USOIL WTIthe current price of WTI crude oil (USOIL) stands around $62.050 to $62.31 per barrel, reflecting a recent rise of about 4.97% compared to previous days. The market has experienced volatility driven by geopolitical tensions and US sanctions on major Russian oil companies, which impact global supply dynamics.
Key Factors Affecting USOIL and Oil Trade Policies
Geopolitical Influences and Sanctions:
US sanctions on Russian oil firms such as Rosneft and Lukoil continue to tighten global supply access, especially affecting supply to large importers like China and India. These sanctions heighten supply-side risks and contribute to price volatility.
US Oil Production and Domestic Policies:
The US remains one of the top global oil producers, with policies encouraging increased output (“drill, baby, drill” style) to ensure energy security and moderate prices domestically while using energy exports as geopolitical leverage.
Trade Agreements and Tariffs:
Trade discussions, such as US-India negotiations, aim to reduce tariffs and expand energy trade, influencing crude demand and pricing. Tariffs and trade restrictions remain important policy tools that may alter trade flows and market access.
OPEC and IEA Production Forecasts:
Global supply forecasts have been revised upward, with expectations of growth to 106-108 million barrels per day by 2026. OPEC production strategies continue to influence market balance and price direction.
Market Volatility and Demand Outlook:
Economic uncertainties, inflation concerns, and shifts toward renewable energy impact demand projections. Demand growth for 2025-2026 has seen downward revisions amid these mixed signals.
Overall, USOIL prices and global oil trade in 2025 are shaped by a complex interplay of geopolitical sanctions, domestic production policies, trade agreements, and evolving market demand, creating significant price volatility and trade flow shifts.
#OIL #WTI #CRUDEOIL #GAS

USOIL : Full analysisHello friends
Well, considering the sharp decline we had, the price has entered a descending channel and is slowly going down in this channel.
Now the price has reached a critical point, namely the bottom of the channel.
We need to see if buyers will support the price at the bottom of the channel like the previous two times or not?
If we do not see support from buyers and the channel is broken, we can expect lower prices.
56.30 and 53 dollars respectively.
But we will most likely see buyers' support in this area and the price could even reach the channel ceiling.
*Trade safely with us*

USOIL Can Rise Higher (Swing Trade Opportunity)USOIL Can Rise Higher (Swing Trade Opportunity): OIL has been falling hard in the recent weeks. One of the reasons was the sub sector rotation. Most funds were being routed from energy to precious metals. Now OIL has completed and M pattern, which means that it can start to rise. So far this has showed a little upward movement which is not a sign of strength but rather an initial invite to the buyers.
Lets see if it gains momentum and becomes substantial.
Not a trade advice as usual.
Follow this channel and switch the notifications on for more. Please support this analysis by liking, commenting, and sharing with friends, colleagues, traders, and trading communities. Thanks👍🙂


WTI Oil: $66 Back on the Cards as Sanctions BiteWTI crude extends its rally this morning after fresh U.S. sanctions on Rosneft and Lukoil sparked renewed supply concerns. The EU’s latest package added to the bullish momentum, sending prices sharply off the $56–57 demand zone.
Technically, the point of control (POC) from the recent volume profile aligns perfectly with the $65.50–66.00 resistance, suggesting this is where price may stall or consolidate before deciding the next leg.
Momentum remains strong, volume is rising, and bulls are clearly in control. As long as WTI holds above $60, a push into $66 looks likely — but expect sellers to reappear at that POC zone.cards — especially as the market reprices geopolitical risk and short-term supply tightness.
Key Levels:
Support: $57.00 / $60.00
Resistance: $62.50 / $65.50–66.00
Next target: $66.00

XTI/USD : Oil Prices Rise Following Trump’s Sanctions DecisionXTI/USD Chart Analysis: Oil Prices Rise Following Trump’s Sanctions Decision
According to the XTI/USD chart, WTI crude is now trading above the key psychological level of $60, marking a sharp rebound of over 3% from October’s lows.
The surge came after U.S. President Donald Trump announced sanctions against major Russian oil producers Rosneft and Lukoil, which together account for more than 5 million barrels of oil per day.
The move is expected to reduce global oil supply; however, media outlets point out that:
→ there is no certainty that China and India will refrain from purchasing Russian crude;
→ previous sanctions introduced under the Biden administration — targeting companies such as Gazprom Neft and Surgutneftegaz — had little impact on Russian oil exports.
What could happen next?
Technical Analysis of the XTI/USD Chart
On 20 October, we noted that two descending channels had formed:
→ Red channel – a long-term pattern that developed following the Middle East escalation in June;
→ Purple channel – indicating accelerated downside pressure driven by rising OPEC+ output and hopes for a U.S.–China trade accord.
Our earlier assumption that the market was oversold and that the Falling Wedge pattern might trigger a bullish reversal proved correct (as shown by the arrow). Following the formation of an inverted head and shoulders pattern, oil prices climbed towards the median line of the purple channel.
At this stage, consolidation appears the most likely scenario, as supply and demand may stabilise around the channel’s median. Much will depend on statements from the White House, since higher oil prices could threaten U.S. inflation objectives.
However, if bullish momentum persists, WTI may continue to rise towards the next resistance area, defined by:
→ the upper boundary of the purple channel;
→ the 8–9 October highs, where a false breakout similar to the bear trap seen on 26 September cannot be ruled out.
This article represents the opinion of the Companies operating under the FXOpen brand only. It is not to be construed as an offer, solicitation, or recommendation with respect to products and services provided by the Companies operating under the FXOpen brand, nor is it to be considered financial advice.

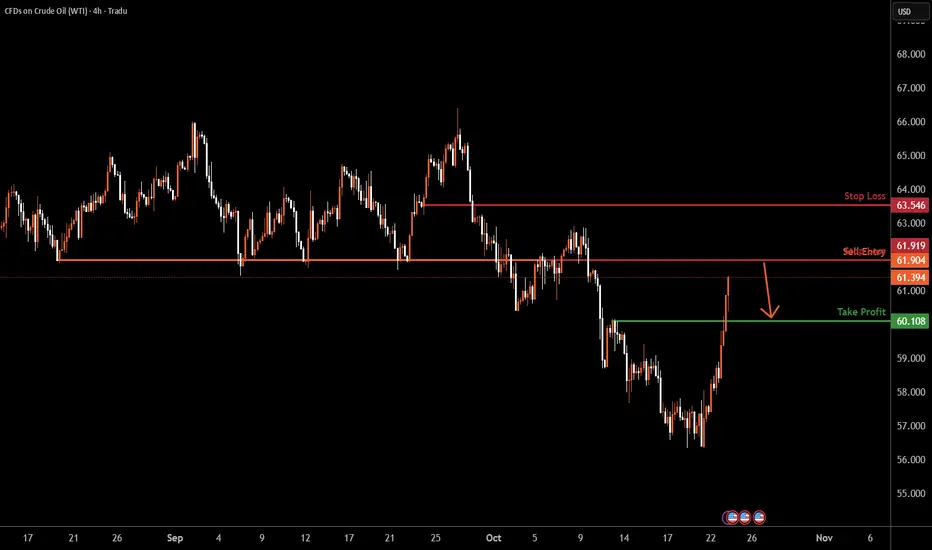
USOIL H4 | Approaching Major Resistance LevelBased on the H4 chart analysis, we could see the price rise to the sell entry which is an overlap resistance and could reverse from this levle to the take profit.
Sell entry is at 61.90, which is an overlap resistance.
Stop loss: 63.54, which is a pullbakc resistance.
Take profit is at 60.10, which is a pullback support.
Stratos Markets Limited (tradu.com ):
CFDs are complex instruments and come with a high risk of losing money rapidly due to leverage. 68% of retail investor accounts lose money when trading CFDs with this provider. You should consider whether you understand how CFDs work and whether you can afford to take the high risk of losing your money.
Stratos Europe Ltd (tradu.com ):
CFDs are complex instruments and come with a high risk of losing money rapidly due to leverage. 70% of retail investor accounts lose money when trading CFDs with this provider. You should consider whether you understand how CFDs work and whether you can afford to take the high risk of losing your money.
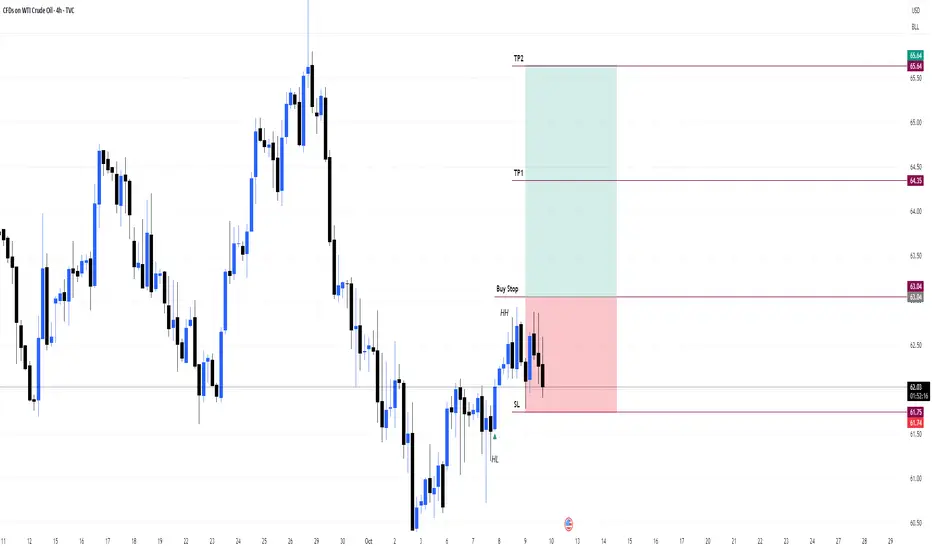
USOILPrice recently formed a Higher High, confirming bullish momentum.
Currently, price is pulling back and forming a Higher Low, maintaining the uptrend structure.
📈 Buy Stop placed above the previous Higher High, anticipating a breakout continuation.
🛑 Stop Loss set just below the Higher Low, where price previously reversed.
🎯 Risk to Reward: 1:2, aiming for a favorable reward relative to the risk.
Structure: Bullish (HH + HL)
Entry Type: Breakout Entry
Confirmation: Structure + Buy Stop Strategy
SL: Below HL | TP: 2x Risk
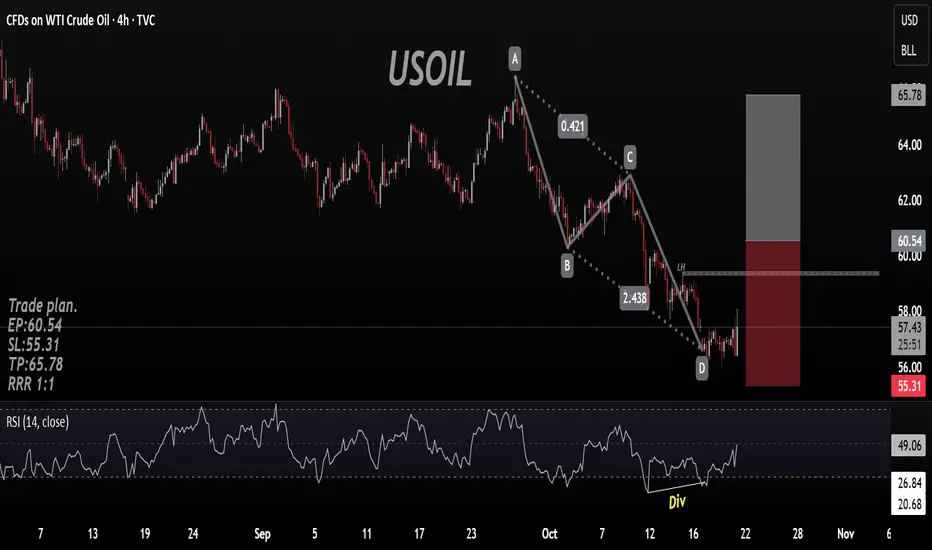
AB=CD Reversal Pattren on USOIL AB=CD reversal pattren with Divergence on Rsi.
Bias Long
Trade plan.
EP:60.54
SL:55.31
TP:65.78
RRR 1:1
WTI Crude oversold bounce capped at 6030 resistanceThe WTI Crude Oil is currently trading with a bearish bias, aligned with the broader downward trend. Recent price action shows a retest of the longer term support, suggesting a temporary relief rally within the downtrend.
Key resistance is located at 6030, a prior consolidation zone. This level will be critical in determining the next directional move.
A bearish rejection from 6030 could confirm the resumption of the downtrend, targeting the next support levels at 5747, followed by 5677 and 5606 over a longer timeframe.
Conversely, a decisive breakout and daily close above 6030 would invalidate the current bearish setup, shifting sentiment to bullish and potentially triggering a move towards 6073, then 6170.
Conclusion:
The short-term outlook remains bearish unless the WTI Crude price breaks and holds above 6030. Traders should watch for price action signals around this key level to confirm direction. A rejection favours fresh downside continuation, while a breakout signals a potential trend reversal or deeper correction.
This communication is for informational purposes only and should not be viewed as any form of recommendation as to a particular course of action or as investment advice. It is not intended as an offer or solicitation for the purchase or sale of any financial instrument or as an official confirmation of any transaction. Opinions, estimates and assumptions expressed herein are made as of the date of this communication and are subject to change without notice. This communication has been prepared based upon information, including market prices, data and other information, believed to be reliable; however, Trade Nation does not warrant its completeness or accuracy. All market prices and market data contained in or attached to this communication are indicative and subject to change without notice.

Market Analysis: WTI Crude Oil Attempts ReboundMarket Analysis: WTI Crude Oil Attempts Rebound
WTI Crude oil is now attempting to recover after sliding toward $56.00.
Important Takeaways for WTI Crude Oil Price Analysis Today
- WTI Crude oil prices extended losses below the $60.00 support zone.
- It cleared a key bearish trend line with resistance at $57.50 on the hourly chart of XTI/USD.
WTI Crude Oil Price Technical Analysis
On the hourly chart of WTI Crude Oil, the price struggled to continue higher above $62.00 against the US Dollar. The price formed a short-term top and started a fresh decline below $61.20.
There was a steady decline below the $60.00 pivot level. The bears even pushed the price below $58.50 and the 50-hour simple moving average. Finally, the price tested $56.00. The recent swing low was formed near $55.94, and the price is now correcting losses.
There was a move above the 23.6% Fib retracement level of the downward move from the $62.45 swing high to the $55.94 low. The price cleared a key bearish trend line with resistance at $57.50.
On the upside, immediate resistance is near the 50% Fib retracement at $59.20. The main hurdle is $59.95. A clear move above $59.95 could send the price toward $62.45. The next stop for the bulls might be $64.00.
If the price climbs further, it could face sellers near $65.00. Immediate support is $57.50. The next major level on the WTI crude oil chart is $55.95. If there is a downside break, the price might decline toward $55.00. Any more losses may perhaps open the doors for a move toward the $52.00 zone.
This article represents the opinion of the Companies operating under the FXOpen brand only. It is not to be construed as an offer, solicitation, or recommendation with respect to products and services provided by the Companies operating under the FXOpen brand, nor is it to be considered financial advice.
