Trade ideas

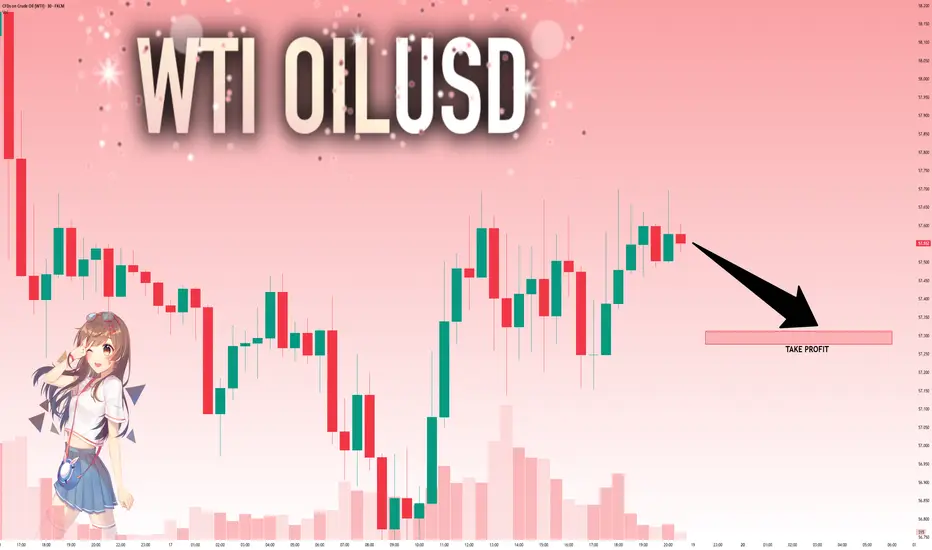
US OIL SUPPORT, RESISTANCE & TRENDLINE ANALYSISThe market is sideways kindly save your capital yall.
Go "long" if it breaks the trendline and 57.45 and aim for 57.80 and 58.14 and if it breaks 58.37 then we might see a good move upside.
Go "Short" if it breaks below 57.12 and breaking the trendline as well will lead to 56.77 and 56.43.
Good Night!!

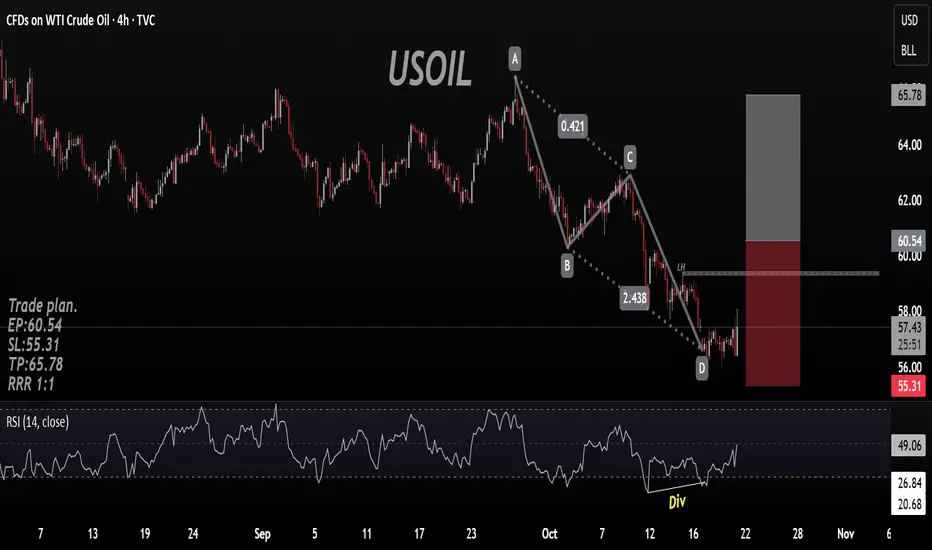
AB=CD Reversal Pattren on USOIL AB=CD reversal pattren with Divergence on Rsi.
Bias Long
Trade plan.
EP:60.54
SL:55.31
TP:65.78
RRR 1:1
USOIL – Downtrend Still IntactUSOIL remains fundamentally weak with technical confirmation of a prevailing downtrend. Short-term pullbacks are likely corrective and may provide better short-entry setups.
Resistance levels:
59.14
60.36
61.91 (Ultimate)
Support levels:
54.81
53.13
51.95 (Ultimate)

OilPrice is trying to break out of a downtrend channel after forming a base around $56.5–$57.
Resistance: $58 (short-term), $59.8, and $63 (major).
Support: $56.5–$57 zone.
Volume shows buying interest near the lows — early sign of accumulation.
If price holds above $58, it could aim for $59.8–$63.
If it fails, a pullback toward $56.2–$55.5 is likely.
➡️ Bias: Mildly bullish if $57.8–$58 holds; otherwise, range-bound to bearish continuation.

USOIL - Bullish ReversalUSOIL has formed falling wedge and double bottom and currently testing the neckline. Entry above last lower high.
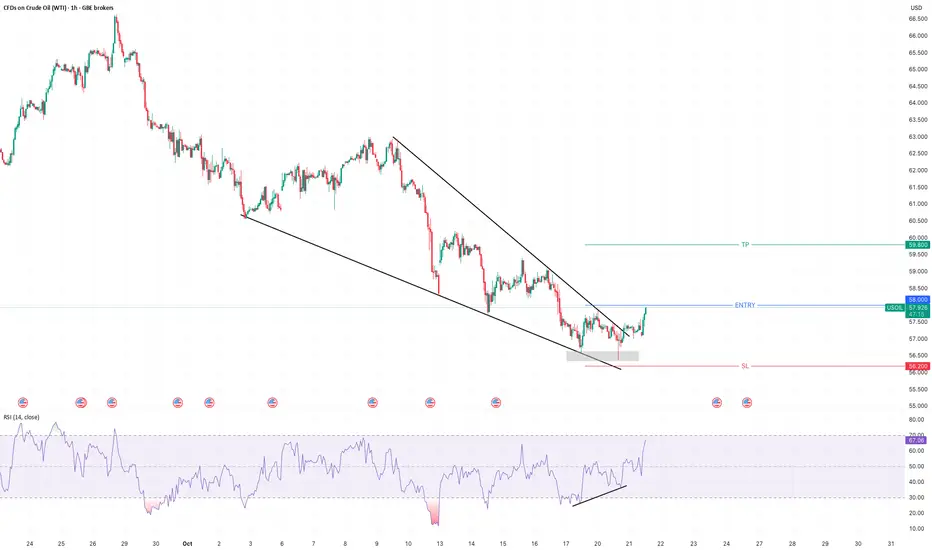
US, OILHI GUYS,
We are still bullish on us oil
NOTE NOTHING HAS CHANGED, JUST LIQUIDITY GRABS IN LOWER TIME FRAMES. HOWEVER H4 IS STILL BULLISH
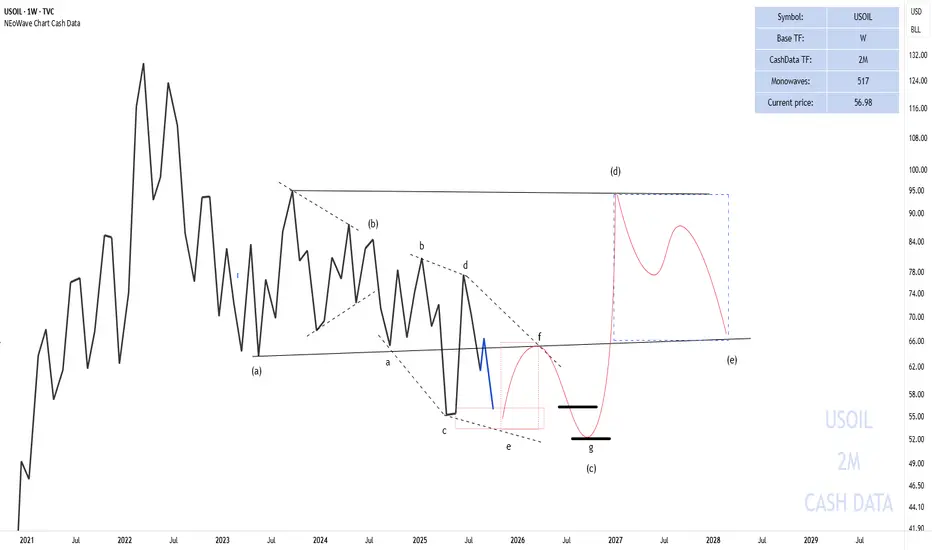
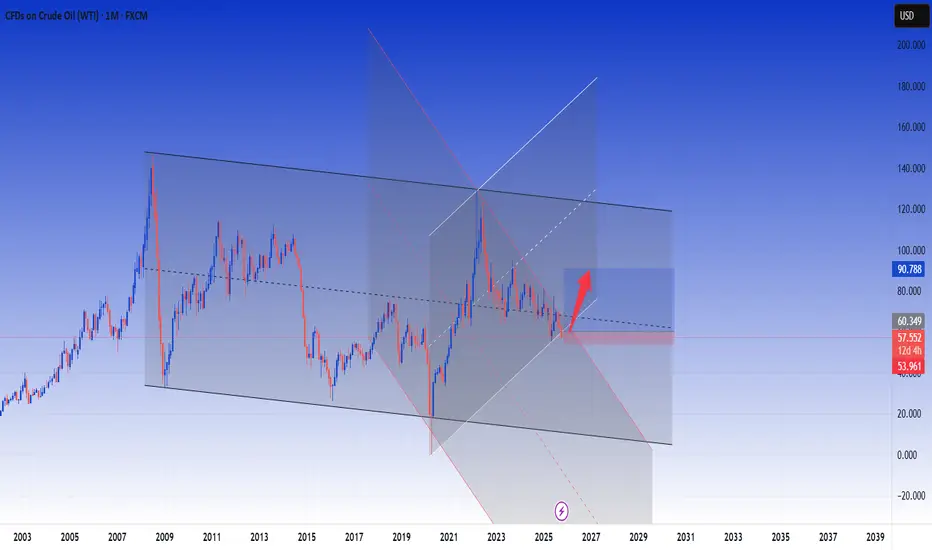
USOIL based on NEoWaveThere has been a lot of demand for oil analysis.
In the 2-month cash data, we see that oil reached $56, and many say there’s a possibility that oil may not touch the high levels above $70 again, but the chart suggests otherwise.
In the 2-month cash data, given the complexity in wave-(c), it appears that a reverse contracting triangle pattern is forming. After the completion of wave-(c), wave-(d) of this triangle could potentially rise to $90.
Currently, we are in wave-(c) of this triangle, which is transforming into a diamond diametric pattern. Wave g of this diametric could end at $56 or in the $50-52 range, completing wave-(c).
The chart will be updated if needed.
Good luck
NEoWave Chart
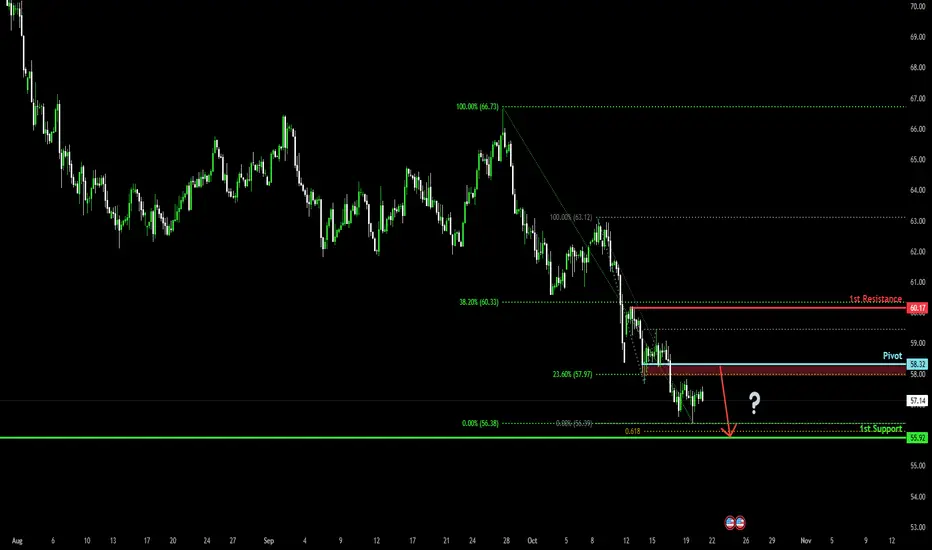
Bearish continuation setup?WTI Oil (XTI/USD) is rising towards the pivot and could drop to the 1st support.
Pivot: 58.32
1st Support: 55.92
1st Resistance: 60.17
Disclaimer:
The above opinions given constitute general market commentary, and do not constitute the opinion or advice of IC Markets or any form of personal or investment advice.
Any opinions, news, research, analyses, prices, other information, or links to third-party sites contained on this website are provided on an "as-is" basis, are intended only to be informative, is not an advice nor a recommendation, nor research, or a record of our trading prices, or an offer of, or solicitation for a transaction in any financial instrument and thus should not be treated as such. The information provided does not involve any specific investment objectives, financial situation and needs of any specific person who may receive it. Please be aware, that past performance is not a reliable indicator of future performance and/or results. Past Performance or Forward-looking scenarios based upon the reasonable beliefs of the third-party provider are not a guarantee of future performance. Actual results may differ materially from those anticipated in forward-looking or past performance statements. IC Markets makes no representation or warranty and assumes no liability as to the accuracy or completeness of the information provided, nor any loss arising from any investment based on a recommendation, forecast or any information supplied by any third-party.
Hellena | Oil (4H): SHORT to support area of 54.00.As I continued to watch oil I realized that the structure I built in the last forecast is still in place. I think we should expect a correction in wave “4” to the 59.3 area, then a continuation of the downward movement at least to the 54.00 support area. This will be the completion of the downward impulse.
I do not exclude the probability of lengthening of wave “3” and in this case there will be no correction and the price will immediately reach the target.
Fundamental context
The oil market remains under pressure as supply continues to outpace demand, raising the risk of a surplus. Forecasts for 2025-2026 indicate higher production growth while consumption slows.
Rising inventories and a shift in the futures curve into contango suggest growing storage levels and weaker near-term demand.
Under these conditions, downside pressure persists, keeping the probability of a further decline high.
Manage your capital correctly and competently! Only enter trades based on reliable patterns!

CRUDE OIL (WTI): The Price Will Drop Lower!
Crude Oil is going to reach the year's low soon.
A confirmed bearish break of a minor structure on a daily time frame
suggest a strong selling pressure.
Be ready to see a test of 55.6 soon.
❤️Please, support my work with like, thank you!❤️

USOIL Is Bearish! Short!
Take a look at our analysis for USOIL.
Time Frame: 4h
Current Trend: Bearish
Sentiment: Overbought (based on 7-period RSI)
Forecast: Bearish
The market is approaching a key horizontal level 57.145.
Considering the today's price action, probabilities will be high to see a movement to 55.504.
P.S
The term oversold refers to a condition where an asset has traded lower in price and has the potential for a price bounce.
Overbought refers to market scenarios where the instrument is traded considerably higher than its fair value. Overvaluation is caused by market sentiments when there is positive news.
Like and subscribe and comment my ideas if you enjoy them!

USOIL: Buy setups during higher-timeframe correctionOIL PRICE WEEKLY OUTLOOK
(Week of Oct 20-24, 2025)
Key Drivers & Risks
Updates in Supply, Demand, and Geopolitical News
EIA (week ending Oct 10): Crude inventories +3.5 million bbl; distillates −4.5 million bbl.
IEA OMR (Oct 2025): Upgraded global supply forecast: +3.0 mb/d in 2025 and +2.4 mb/d in 2026, while demand grows only ~0.7 mb/d per year ⇒ signaling a large surplus risk and downward pressure on prices.
OPEC (Oct 2025): Maintains demand growth outlook of +1.3 mb/d for 2025, but acknowledges a smaller deficit in 2026 as OPEC+ output rises; September production increased by ~630 kb/d.
Maritime risk in the Red Sea / Gulf of Aden: Over the weekend, a gas carrier reportedly caught fire following a possible attack off Yemen’s coast, leading to higher shipping risk premiums, though no major disruption to trade flows has been reported yet.
Watchlist for the Week Ahead
EIA Weekly Report (Oct 22): Focus on crude and distillate inventories, and any signs of policy or flow adjustments.
Maritime security updates in the Red Sea / Gulf of Aden / Strait of Hormuz — monitor frequency and severity of incidents.
China data: imports, refinery runs, and inventories — potential signals of stockpiling at lower price levels.
Any notable demand-side surprises (if any emerge).
Overall View
Oil prices are expected to gradually decline within a relatively narrow range of $70–$50 through mid-2026.
Short-term rebounds may occur due to low price levels and heightened transport risk headlines.
China’s potential restocking activity could provide limited demand-side support.
* Trend: assessed using at least three trend indicators, with market structure as the primary guide.
** Weak or Reversal Signals: Assessed based on one of our criteria for trend reversal signals.
*** Support/Resistance: Selected from multiple factors – static (Swing High, Swing Low, etc.), dynamic (EMA, MA, etc.), psychological (Fibonacci, RSI, etc.) – and determined based on the trader’s discretion.
**** Our advice takes into account all factors, including both fundamental and technical analysis. It is not intended as a profit target. We hope it can serve as a reference to help you trade more effectively. This advice is for informational purposes only and we assume no responsibility for any trading results based on it.
George Vann @ ZuperView
XTI/USD Chart Analysis: Oil Prices Fall to Yearly LowsXTI/USD Chart Analysis: Oil Prices Fall to Yearly Lows
As shown on the XTI/USD chart, WTI crude is trading below $57 today, with the 2025 low sitting near $55. Several factors are currently weighing on oil prices:
→ Uncertainty surrounding the US-China trade deal — the world’s two largest oil consumers — continues to cloud the outlook for global growth and crude demand.
→ Increased output from OPEC+ members has added further pressure, with the IEA last week raising its forecast for a global oil surplus.
→ A decline in the risk premium following the peace agreement in the Middle East has also reduced support for oil prices.
So, what could happen next?
Technical Analysis of the XTI/USD Chart
Seven days ago, we noted that:
→ In the long-term context, oil price fluctuations — following the June escalation in the Middle East — have formed a downward channel (shown in red). The current price has now slipped below its lower boundary.
→ In the short term, the pace of the decline appears to be accelerating, highlighted by the purple trajectory lines.
At that time, we suggested a scenario in which WTI could drift towards its yearly low near $55, which is now materialising. However, note the following:
→ The RSI indicator is hovering near oversold territory.
→ The chart shows signs of a Falling Wedge pattern, which often precedes a bullish reversal.
Given these signals, it is reasonable to assume that, after a roughly 10% decline since the start of the month, bears may begin locking in profits on short positions. This could trigger a technical rebound in WTI prices — potentially towards the resistance area defined by:
→ The lower boundary of the red channel;
→ The psychological level of $60;
→ The median line of the purple channel.
This article represents the opinion of the Companies operating under the FXOpen brand only. It is not to be construed as an offer, solicitation, or recommendation with respect to products and services provided by the Companies operating under the FXOpen brand, nor is it to be considered financial advice.

Crude oil -DAILY- 20/10/2025Oil prices fell after a third straight weekly decline as traders reacted to easing U.S.–China trade tensions pushing WTI toward $56 a barrel amid optimism over upcoming trade talks. China’s economy slowed for a second consecutive quarter, though Beijing maintained its 5% growth target. Oil futures are heading for a third monthly loss, pressured by an expected supply surplus through 2026, according to the IEA. Trump said he plans a second meeting with Putin to discuss ending the war in Ukraine, though prior talks have achieved little. Citigroup warned that any de-escalation could push oil toward $50 a barrel. Market indicators suggest weakness, with near-term spreads narrowing and longer-term contracts shifting into bearish contango.
On the technical side, crude oil price has extended its aggressive bearish trend last week with no major signs of reversing. Apart from the extreme oversold Stochastic oscillator there are no other signs of a bullish correction. The faster 50-day simple moving average is trading below the slower 100-day simple moving average validating the overall bearish trend in the market while the Bollinger Bands are quite expanded showing that there is increased volatility in the market for crude oil hinting that there is potential for sharp moves in the upcoming sessions. Eventhough, the area of $62 is the major technical resistance level, it seems that it might need some time to retest this level. The lower band of the Bollinger Bands seems to be the first level of technical support for the price while the area of $56 might pose some support since its the multiyear low which was last tested in early May 2025.
Disclaimer: The opinions in this article are personal to the writer and do not reflect those of Exness

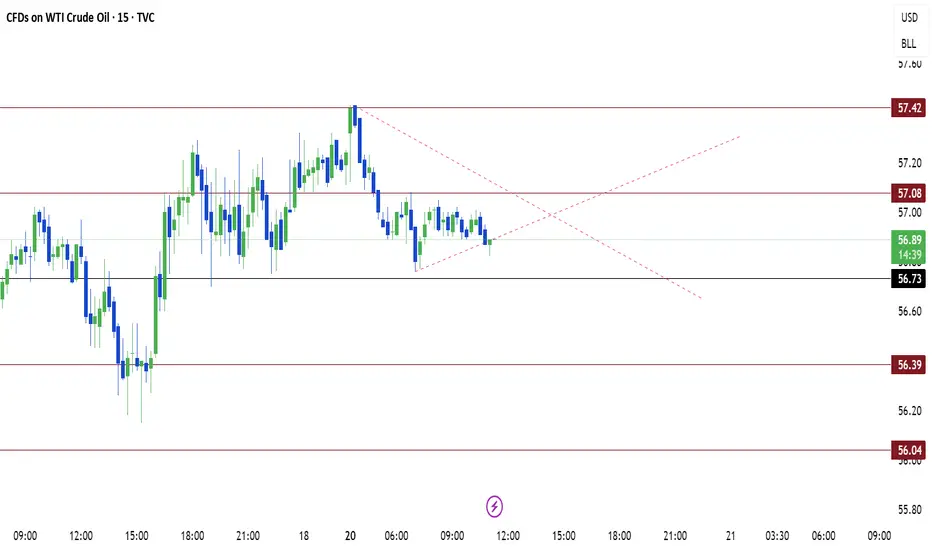
US OIL SUPPORT, RESISTANCE & TRENDLINE ANALYSISGo "SHORT" if it breaks 56.73 with 56.39 as first support if it breaks that then go further till 56.04.
Go "LONG" if it breaks 57.08 with 57.42 as the target.
Note: My personal over all view is Bearish.
USOIL Trading IdeaBased on Simple Technical Analysis ( Trendline + Support & Resistance )
Risk Disclaimer:
Please be advised that I am not telling anyone how to spend or invest their money. Take all of my analysis as my own opinion, as entertainment, and at your own risk. I assume no responsibility or liability for any errors or omissions in the content of this page, and they are for educational purposes only. Any action you take on the information in this analysis is strictly at your own risk. There is a very high degree of risk involved in trading. Past results are not indicative of future returns. Good luck :-)
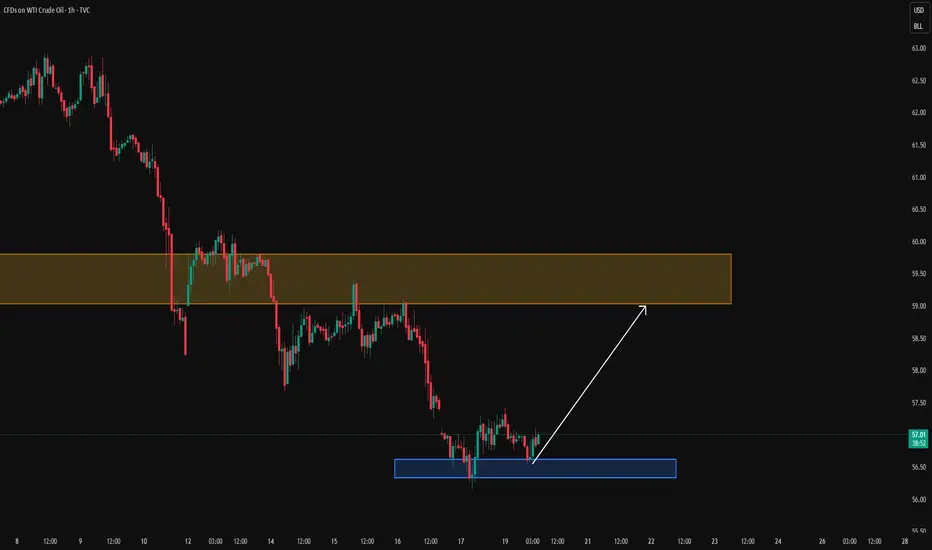
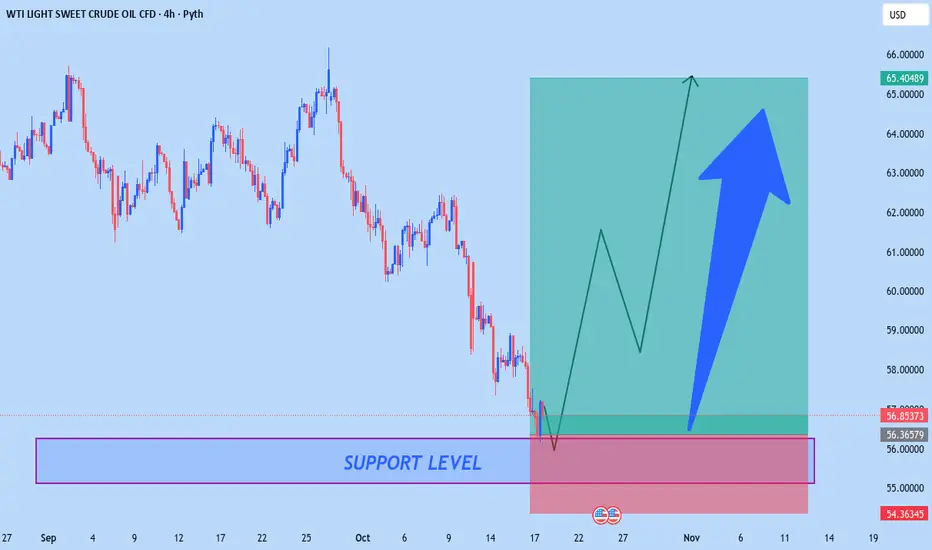
The US-Oil will jump from the historic Support LevelHello Traders
In This Chart US-OIL HOURLY Forex Forecast By FOREX PLANET
today US-OIL analysis 👆
🟢This Chart includes_ (US-OIL market update)
🟢What is The Next Opportunity on US-OIL Market
🟢how to Enter to the Valid Entry With Assurance Profit
This CHART is For Trader's that Want to Improve Their Technical Analysis Skills and Their Trading By Understanding How To Analyze The Market Using Multiple Timeframes and Understanding The Bigger Picture on the Charts
USOIL Oil prices are heavily influenced by supply/demand dynamics, geopolitical tensions, OPEC production policies, economic growth indicators, and inventory data.
Trading Tips:
Monitor OPEC announcements, especially decisions on quotas and production cuts.
Watch for geopolitical events in oil-producing regions like Iran, Venezuela, and the Middle East.
Keep an eye on US crude inventory reports, dollar strength, and macroeconomic data affecting demand.
Head of OPEC: Haitham Al-Ghais, Kuwait.
USOIL MARKET STRUCTURE .
WATCH KEY DEMAND FLOOR 55.932-55.899
BREAK AND CLOSE NEXT WATCH WILL BE 50.499-50.78$
WEEKLY SUPPORT ON DEMAND WILL BE 44.7%-45$ ZONE
KEY RSISTANCE 66.219-65.567
layer by layer ...we are looking at oil sell position and i will communicate soon on any potential position.
GOODLUCK
#OIL #USOIL #USD #DOLLAR #US1OY #DXY

19.10.25 Crude Oil WeeklyOil is about to approach the Weekly Demand Zone
Weekly (Higher Time Frame)
The Weekly Demand have 3 basing candle's: the Basing candle are so small it means price have been in balance til the buy pressure came in.
Also you the Demand zone was formed in a previously Supply zone. It means Supply became Demand (flip zone) and can indicate an uptrend.
Daily ( Lower Time Frame)
We are Having An Level on top of Level situation. Both level are covered in from Higher time frame. i will use both levels as my risk zone.
In the moment i reach twice profit of my risk i will move my stoplose to breakeven.
When we reach the first strong Supply i take of 75% of profit and let run the other 25% and trail my stoplose

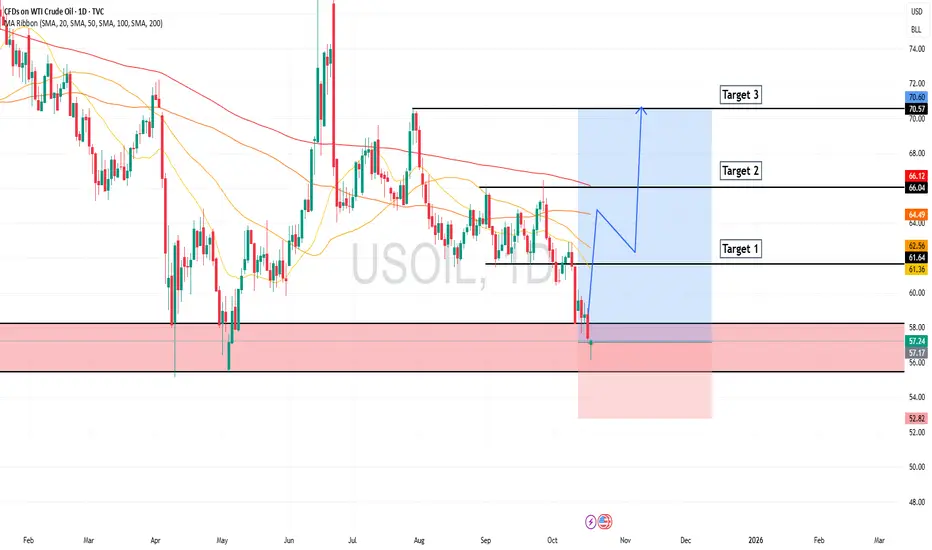
USOIL (WTI Crude Oil) – Bullish Reversal Setup | 4H AnalysisMarket Context
WTI Crude Oil has been in a strong downtrend over the past few weeks, breaking multiple support levels.
However, price has now reached a key higher-timeframe demand zone (55.80–57.00), which previously acted as a strong reaction area in the past.
The recent 4H candles show clear rejection wicks and slowing bearish momentum — signaling that sellers may be losing control.
Technical Breakdown
Structure: The downtrend may be completing its final leg, forming a potential double-bottom or accumulation phase.
Demand Zone: The area between 55.80–57.00 is aligning with previous volume imbalance and untested demand.
Liquidity Sweep: Price grabbed liquidity below prior lows and quickly bounced back — a classic smart money reversal sign.
💡 Trade Plan
Entry Zone: 56.80 – 57.20 (after confirmation or retest)
Stop-Loss: Below 55.80 (structure break / demand invalidation)
Take-Profit Targets:
🎯 TP1: 61.00 (first resistance / supply area)
🎯 TP2: 64.70 (major 4H resistance & potential reversal completion point)
🧭 Bias & Outlook
Bullish, as long as price holds above 55.80 and continues forming higher lows.
A break below this level would invalidate the setup and signal continuation of the broader bearish trend.
🧠 Summary :
Oil has reached an oversold demand region, showing signs of accumulation and liquidity sweep.
Early confirmation of buyers stepping in could trigger a strong corrective move toward 61.00–64.70.
This is a medium-term swing setup with solid risk-to-reward potential.

USOIL NEW OUTLOOK According to H4 analysis USOIL market is in falling pressure from last couple day now market at SUPPORT LEVEL this is the best chance for buyer to go long from SUPPORT LEVEL so if you are interested then go long
TRADE AT YOUR OWN RISK
REGARD ALBERT
USOIL: Absolute Price Collapse Ahead! Short!
My dear friends,
Today we will analyse USOIL together☺️
The in-trend continuation seems likely as the current long-term trend appears to be strong, and price is holding below a key level of 57.552 So a bearish continuation seems plausible, targeting the next low. We should enter on confirmation, and place a stop-loss beyond the recent swing level.
❤️Sending you lots of Love and Hugs❤️