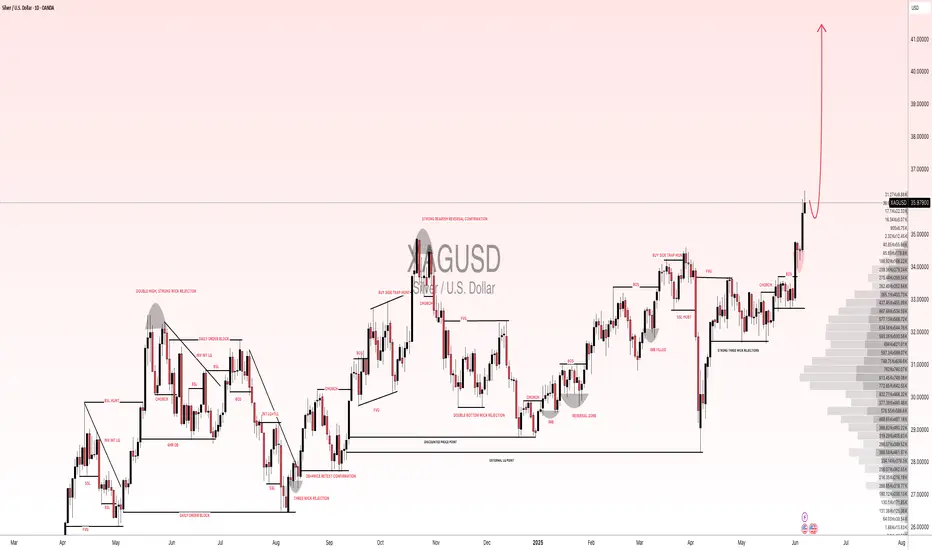
SILVER (XAGUSD): New ATH & What is Next
Silver successfully broke through a historic resistance
based on a previous ATH.
Bullish keep pushing strong and the market may continue rising easily.
The closest strong psychological resistance is 55.0 level.
It can be reached soon.
❤️Please, support my work with like, thank you!❤️
XAGUSD01 trade ideas

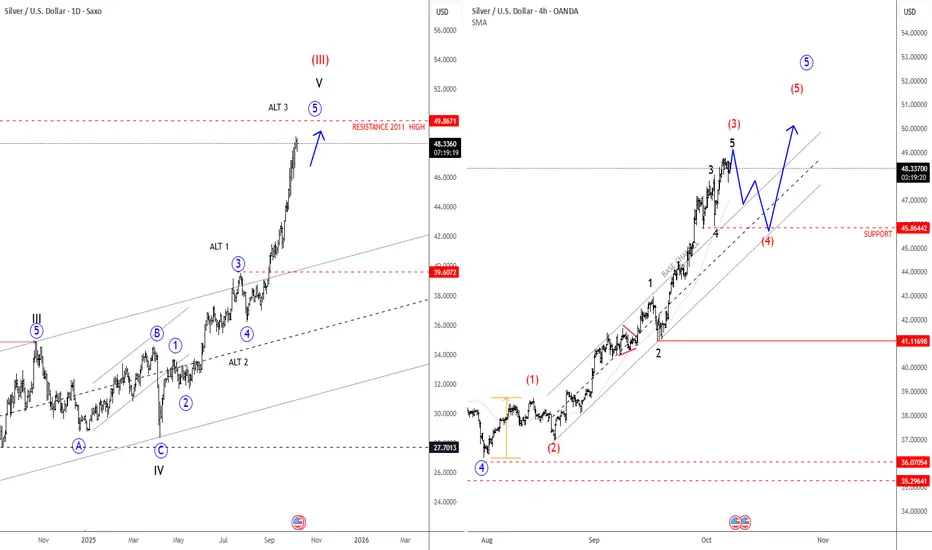
Silver Is Extending Impulsively Higher; All-Time Highs SoonSilver Is Extending Impulsively Higher, which can push the price into all-time highs from a technical point of view and by Elliott wave model.
Silver is on the rise and has been outperforming gold quite a lot over the last week, and it looks like an extended leg up is still in progress; seems like wave three of an extended impulse, therefore more gains are possible after next three-leg retracement. Based on the 4-hour chart, there is a chance that price goes towards 50usd, but there can be some new pullback first. Ideally red wave (4) could stabilize near 45.86. Only a sharp impulse down closer to 43 level will be an indication that higher degree wave four has started.
Higher Time frame charts show an ongoing bull cycle that is now targeting the high from April 2011, which could be the next major level and a potential area for a new retracement, maybe sometime in 2026.
Silver to $700 USD Double cup and handlle formation on monthly. Fundamentals for Silver are very good. consumption has been over production for many years, and most Silver is mined as a byproduct of mining other metals so it is very difficult to expand production of Silver and many dedicated Silver mines suffered from jurisdiction risk and may be subject to nationalization. For decades the Comex has systematically suppressed the price of Silver via 300+:1 Paper to physical ounces being traded and unlimited short selling on paper silver trading.
This has lead to silver being like a coiled roll of steel ready to explode, expect markets to break and the price of Silver to go to unbelievable prices.

How much longer can it sustain this velocity?If silver reaches $53.50, then it would have reproduced a similar move done back in 2010-2011.
How much longer can it sustain this velocity?

#XAGUSD: A Strong Bullish Move, Possible Target at $45?Silver is currently experiencing a correction, but the overall price remains bullish. Analysing the data, we can see a potential price reversal in our area of interest. Following the recent higher high, price is poised to create another record high. We should closely monitor volume and price behaviour. A strong volume signal would indicate a potential bullish move in the future.
Good luck and trade safely.
Like and comment for more!
Team Setupsfx_

Silver XAG/USD Eyes 49+ – Uptrend Intact, Pullback Could Fuel MoHello everyone,
Silver OANDA:XAGUSD is showing a strong uptrend and appears “well-fueled” to reach the 49+ region in the short term. This rally is supported not only by technical factors but also by a volatile macro backdrop. In the US, CPI and PCE metrics, especially Core, remain key drivers: softer-than-expected readings reduce real yields, weaken the USD, and boost silver; hotter prints apply pressure.
Growth and input-cost data such as ISM/PMI (Manufacturing & Services), notably Prices Paid, influence industrial demand – electronics, solar – but extreme readings could push yields and USD higher, offsetting the impact. Fed statements and FOMC minutes are also critical: dovish tones favor silver, hawkish stances weigh on price. ETF inflows and speculative positions further support the rally, with SLV, SIVR showing strong inflows and CFTC net longs rising.
On the 4H chart, the technical structure remains robust: price stays above the ascending Ichimoku cloud, FVG steps form and partially fill, producing healthy “push-rest-push” behavior. Key levels include support at 48.05–48.20, deeper at 47.60–47.80; resistance near 48.85–49.00, then 49.40, with higher targets at 49.80–50.00.
The preferred scenario is a shallow pullback to 48.05–48.20 to gather momentum, followed by a breakout through 48.85–49.00 toward 49.40; if buying pressure persists, 49.80–50.00 is reachable. This is supported by technical alignment, Ichimoku support, FVG steps, and a favorable macro backdrop: soft CPI/PCE/ISM data or dovish Fed moves lower real yields and USD, triggering strong breakout. Even neutral news favors buy-the-dip as long as 48.05–48.20 holds . The invalidation level is a 4H close below 47.60.
What do you think – will silver push past 49+, or will it need a corrective leg first?

Silver Pulls Back from Recent HighsDuring the current session, silver has started to retreat from its recent highs, posting a decline of more than 2.4% in the short term. This movement has led to a renewed bearish bias in price action, driven mainly by the strengthening of the U.S. dollar. The DXY Index, which measures the dollar’s performance against other major currencies, remains above the 98-point level, reflecting a renewed firmness of the greenback. This strength has reduced investor appetite for precious metals, limiting silver’s upward momentum. If the dollar continues to strengthen, selling pressure on silver could intensify in the coming sessions.
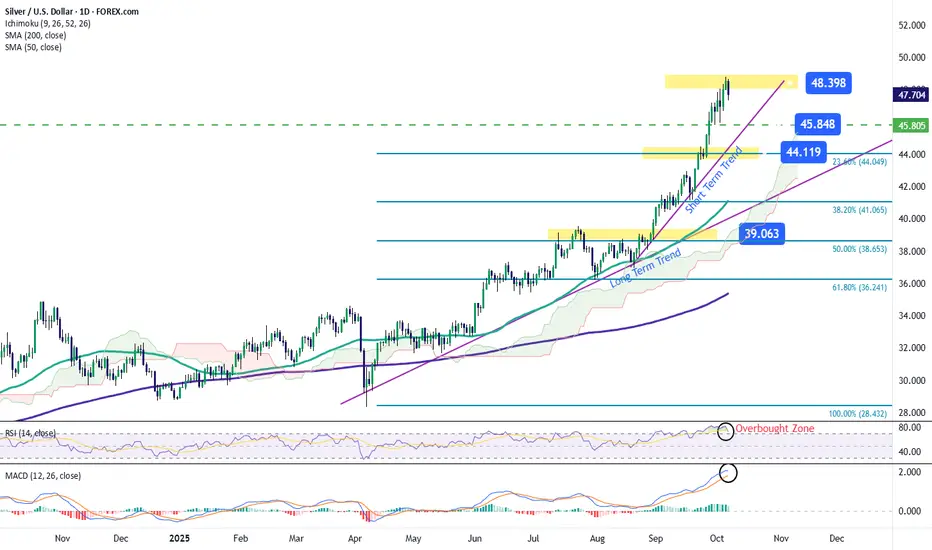
Short-Term Uptrend Remains Intact
Since late August, silver has maintained a pronounced upward trend that remains dominant in the short term. Although some bearish corrections have been observed, they have not yet signaled a structural change in the trend. Therefore, as long as no clear selling signals emerge, the bullish structure continues to be the key pattern to watch at this stage.
RSI
The RSI line continues to hover near the overbought level (70), reflecting an imbalance caused by the recent surge in buying momentum. This could lead to price exhaustion and short-term downward corrections if the overbought condition persists.
MACD
The MACD histogram remains above the zero line, confirming a dominant bullish momentum in recent sessions. However, the MACD and signal lines are beginning to converge, which could foreshadow a bearish crossover and indicate exhaustion in the upward impulse. If this crossover occurs, the market could enter a period of indecision, leaving room for more pronounced pullbacks in the short term.
Key Levels to Watch:
$48 per ounce – Resistance: Corresponds to the recent peak reached by silver. A sustained move above this level could trigger a stronger bullish trend and reinforce a dominant buying bias.
$45 per ounce – Intermediate Resistance: Represents a technical barrier that could limit upside momentum and serve as a potential pivot zone for short-term corrections.
$44 per ounce – Key Support: Aligns with the 23.6% Fibonacci retracement level, acting as the most relevant short-term support. A break below this level could threaten the current bullish trend and shift the outlook toward a more pronounced bearish bias.
Written by Julian Pineda, CFA – Market Analyst
SILVER SELLERS WILL DOMINATE THE MARKET|SHORT
SILVER SIGNAL
Trade Direction: short
Entry Level: 5,140.8
Target Level: 5,029.5
Stop Loss: 5,214.4
RISK PROFILE
Risk level: medium
Suggested risk: 1%
Timeframe: 1h
Disclosure: I am part of Trade Nation's Influencer program and receive a monthly fee for using their TradingView charts in my analysis.
✅LIKE AND COMMENT MY IDEAS✅

SILVER Free Signal From ATH! Sell!
Hello,Traders!
SILVER hovers just below its all-time high at 50$, showing clear signs of exhaustion as Smart Money distributes near premium pricing. A short-term correction is likely as liquidity above is swept and price seeks rebalancing. Time Frame 3H.
-------------------
Stop Loss: 50.06$
Take Profit: 47.74$
Entry: 48.87$
Time Frame: 3H
-------------------
Sell!
Comment and subscribe to help us grow!
Check out other forecasts below too!
Disclosure: I am part of Trade Nation's Influencer program and receive a monthly fee for using their TradingView charts in my analysis.

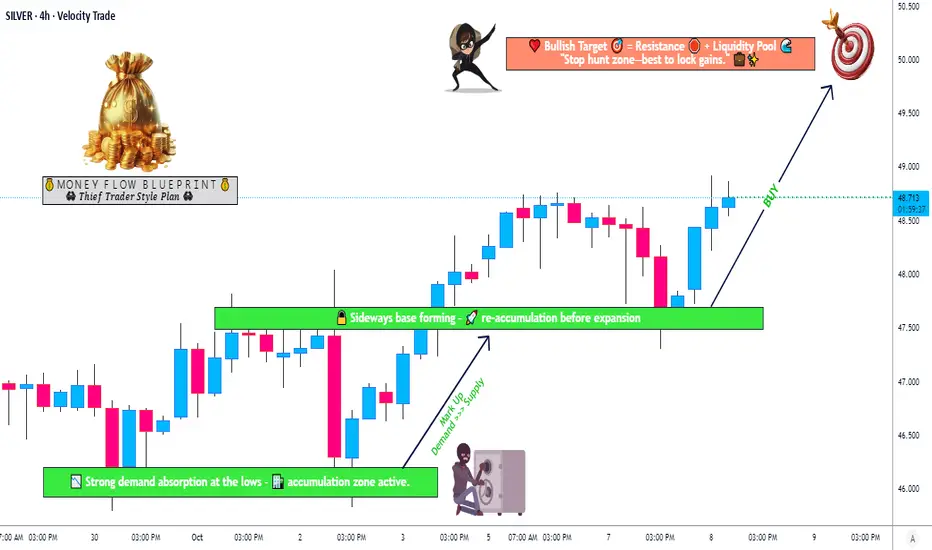
Silver Price Action Update – Smart Money Reaccumulation PhaseXAG/USD "SILVER vs U.S. DOLLAR" — Metal Market Cash Flow Management Strategy 💰
Thief Strategy | Layered Entry | Swing / Day Trade Plan
🧭 Plan Overview
The Bullish momentum in Silver (XAG/USD) has been confirmed through accumulation and re-accumulation phases, signaling a potential continuation move upward.
Smart money appears to be building positions below major resistance — time for us to follow the metal flow. ⚙️
💎 Entry Plan — Thief Layer Style
Thief Strategy = Layered Limit Entries 🧠
We use multiple limit orders to build a smarter position gradually — instead of chasing the price.
Entry Layers:
47.500
48.000
48.500
(You can add more layers based on your own plan and risk appetite.)
🛑 Stop Loss (SL)
This is the Thief SL @47.000.
However, dear Ladies & Gentlemen (Thief OGs) — please manage your own risk.
It’s your money, your strategy, and your exit. 💼
“Make money → Take money → Protect money.”
🎯 Target Zone
A strong resistance zone + overbought conditions may create a trap at the highs.
So, when Silver reaches around $50.000, be smart and secure your profits before the metal traps the late buyers.
Remember: we steal profits, not dreams. 🕶️
💬 Note from the Thief OG
This is a Thief-style strategy — meant for educational fun and insight sharing.
Not a signal service or financial advice.
Use your own judgment and always plan your risk ahead of your entries.
Let’s manage our cash flow, not our emotions. ⚖️
🌍 Related Pairs to Watch (Correlation Check)
OANDA:XAUUSD (Gold) → Often moves in sync with Silver; watch for Gold strength confirmation.
💵 TVC:DXY (U.S. Dollar Index) → Inverse correlation; a weaker USD supports Silver upside.
💰 OANDA:AUDUSD & OANDA:NZDUSD → Commodity-linked currencies; bullish moves support Silver’s strength.
OANDA:XCUUSD → Industrial metals correlation; when Copper rallies, Silver often follows.
Keep your eyes on these pairs — they reveal how liquidity shifts across the metals and forex markets.
✨ “If you find value in my analysis, a 👍 and 🚀 boost is much appreciated — it helps me share more setups with the community!”
⚠️ Disclaimer:
This is a Thief-style trading strategy — shared just for fun and educational purposes.
Always do your own research and trade responsibly. 🧩
#XAGUSD #SilverAnalysis #MetalsMarket #SwingTrade #DayTrading #TechnicalAnalysis #ThiefStrategy #LayeredEntry #CommodityTrading #SmartMoney #BullishSetup #TradingViewCommunity #MarketFlow #TradeResponsibly
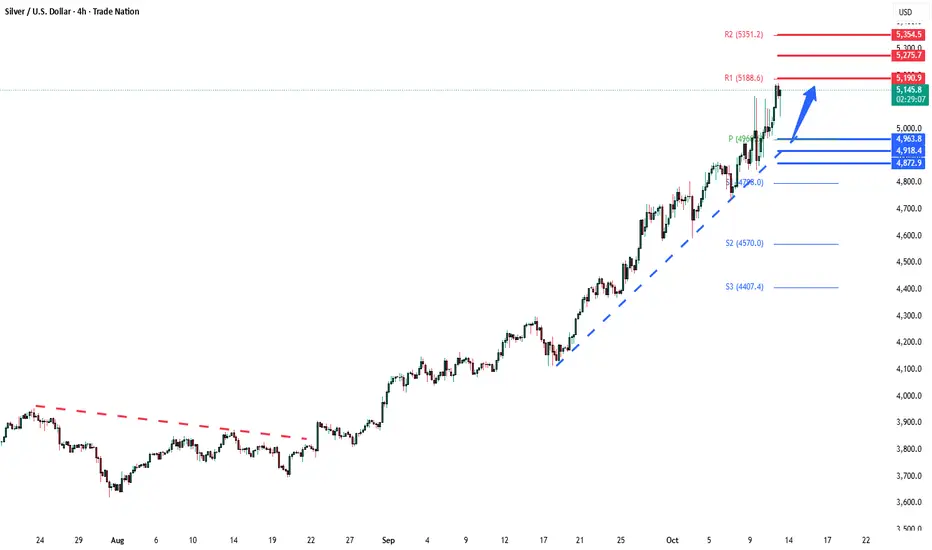
Silver bullish breakout supported at 4964The Silver remains in a bullish trend, with recent price action showing signs of a continuation breakout within the broader uptrend.
Support Zone: 4964 – a key level from previous consolidation. Price is currently testing or approaching this level.
A bullish rebound from 4964 would confirm ongoing upside momentum, with potential targets at:
5190 – initial resistance
5275 – psychological and structural level
5355 – extended resistance on the longer-term chart
Bearish Scenario:
A confirmed break and daily close below 4964 would weaken the bullish outlook and suggest deeper downside risk toward:
4920 – minor support
4870 – stronger support and potential demand zone
Outlook:
Bullish bias remains intact while the silver holds above 4964. A sustained break below this level could shift momentum to the downside in the short term.
This communication is for informational purposes only and should not be viewed as any form of recommendation as to a particular course of action or as investment advice. It is not intended as an offer or solicitation for the purchase or sale of any financial instrument or as an official confirmation of any transaction. Opinions, estimates and assumptions expressed herein are made as of the date of this communication and are subject to change without notice. This communication has been prepared based upon information, including market prices, data and other information, believed to be reliable; however, Trade Nation does not warrant its completeness or accuracy. All market prices and market data contained in or attached to this communication are indicative and subject to change without notice.
Silver Bounce From Support After RetracementSilver is giving a "Buy" entry after retracement on 1H and 4H timeframes. It has also bounced from support, indicating that it can further go up.
Let's take a 1:1 trade here.

Silver Bullet/Rocket Schedule. 11/Oct/25XAGUSD rocket launching might failed again on 3rd attempt at 56 +/- latitude on early 2026..before successfully shooting to outer space

SilverXAGUSD
- Order Block
- Double Top as an corrective pattern in Short Time Frame
- Break of Structure
- Completed " 12345 " Impulsive Waves and " AB " Correction
- Fair Value Gap

Tripple Top Silver now Traded at Triple top zone
51/52$ is supply zone.
So if not close weekly above this level
We seen side ways to Correction in silver
5 to 25% down side seen

Monthly Metals Analysis:Silver (XAGUSD), Issue 210 (Free Access)The analyst believes that the price of XAGUSD will increase within the time specified on the countdown timer. This prediction is based on a quantitative analysis of the price trend.
___Please note that the specified take-profit level does not imply a prediction that the price will reach that point. In this framework of analysis and trading, unlike the stop-loss, which is mandatory, setting a take-profit level is optional. Whether the price reaches the take-profit level or not is of no significance, as the results are calculated based on the start and end times. The take-profit level merely indicates the potential maximum price fluctuation within that time frame.

silver-BULLISH POTENTIAL ZONEsilver is in strong bull run as it is moving in a ascending parallel channel wait for its 0.5 retracment to take entry.

XAGUSD(SILVER):To $60 the silver is new gold, most undervaluedSilver has shown remarkable bullish behaviour and momentum, in contrast to gold’s recent decline. Despite recent news, silver remains bullish and unaffected by these developments. We anticipate that silver will reach a record high by the end of the year, potentially reaching $60.
There are compelling reasons why we believe silver will be more valuable in the coming years, if not months. Firstly, the current price of silver at 36.04 makes it the most cost-effective investment option compared to gold. This presents an attractive opportunity for retail traders, as gold may not be suitable for everyone due to its nature and price.
Silver’s price has increased from 28.47 to 36.25, indicating its potential to reach $60 in the near future. We strongly recommend conducting your own analysis before making any trading or investment decisions. Please note that this analysis is solely our opinion and does not guarantee the price or future prospects of silver.
We appreciate your positive feedback and comments, which encourage us to provide further analysis. Your continuous support over the years means a lot to us.
We wish you a pleasant weekend.
Best regards,
Team Setupsfx
Silver Price Reaches Record HighSilver Price Reaches Record High
The previous peak was set in 1980, but this week the price of silver rose above $53 for the first time ever, as shown on the XAG/USD chart.
Bullish sentiment has been driven by political factors, sustained demand from central banks, and the metal’s growing use in modern industries such as renewable energy.
Meanwhile, media reports are adding to the sense of market frenzy, noting:
→ shortages in physical supply;
→ forced liquidation of short positions (the “short squeeze” effect);
→ bold analyst forecasts — with a CNBC survey suggesting silver could double from current levels to reach $100.
Technical Analysis of the XAG/USD Chart
In earlier analysis of the XAG/USD chart, we:
→ identified an upward channel;
→ noted that silver’s rise was slowing around the $48.75 level, though new record highs in gold could spur the “silver bulls”.
That slowdown has proved to be merely a pause before a breakout to fresh 45-year highs. The ascending channel has maintained its slope but widened upward — notably, the current all-time high sits along the upper boundary of this expanded channel.
Key observations:
→ A sharp drop of more than 5% over the past two candles signals strong selling pressure, likely linked to profit-taking after a roughly 17% rise over the past 30 days.
→ Long lower wicks on the recent wide candles (as indicated by the arrow) show active buying interest.
→ The rise in the ATR indicator became evident as the market broke through the key psychological level of $50 per ounce.
The increase in volatility means traders may need to adjust their strategies — it can also signal that a market reversal could be nearing, as extreme price swings often mark the end of prolonged trends.
For now, however, demand remains strong enough to keep the market within its upward channel:
→ bulls are likely to view the $50–50.50 area as key support;
→ bears may look to reassert control if XAG/USD attempts to climb further above $53.
This article represents the opinion of the Companies operating under the FXOpen brand only. It is not to be construed as an offer, solicitation, or recommendation with respect to products and services provided by the Companies operating under the FXOpen brand, nor is it to be considered financial advice.

Silver – Record Highs and Increased Volatility to Contend WithSilver has literally jumped to the forefront of commodity market traders’ screens in October as it has soared to record highs, followed by an increased period of volatility, before then moving to even higher levels again this morning. The main reasons seem to be Silver’s attraction as an alternative to Gold as a safe haven/debasement asset in this current period of uncertainty.
Traders are concerned about increased trade tensions, a prolonged US government shutdown, weaker global growth, excessive levels of government debt, inflation, a war in Ukraine and what the Federal Reserve may do next regarding interest rates. It is quite an extensive list!
Add to this a historic physical shortage of Silver, soaring borrowing costs and reduced liquidity in a market that is much smaller than its big brother, Gold, and you have a recipe for a volatile asset that is not to be entered without strong risk management, a good understanding of the fundamentals and a serious consideration of important technical levels.
Silver started the month at 46.647, dipped to a low of 45.903 on October 2nd and then hasn’t looked back, posting a series of new multi-year and then record highs all the way to a peak this morning at 53.50. However, it hasn’t been plain sailing, with an average 5% trading range over the last three days alone. An important risk factor to consider.
Looking forward across this week, Silver prices could be influenced by the next headlines outlining where the direction of trade tensions between the US and China are moving, including updates on whether President’s Trump and Xi will meet later this month as had been originally planned. Their first meeting for 6 years.
Progress updates on the stalemate between Democrats and Republicans that has forced the US government into a 2 week shutdown may also be relevant, alongside any easing in the current supply issues in the physical Silver market.
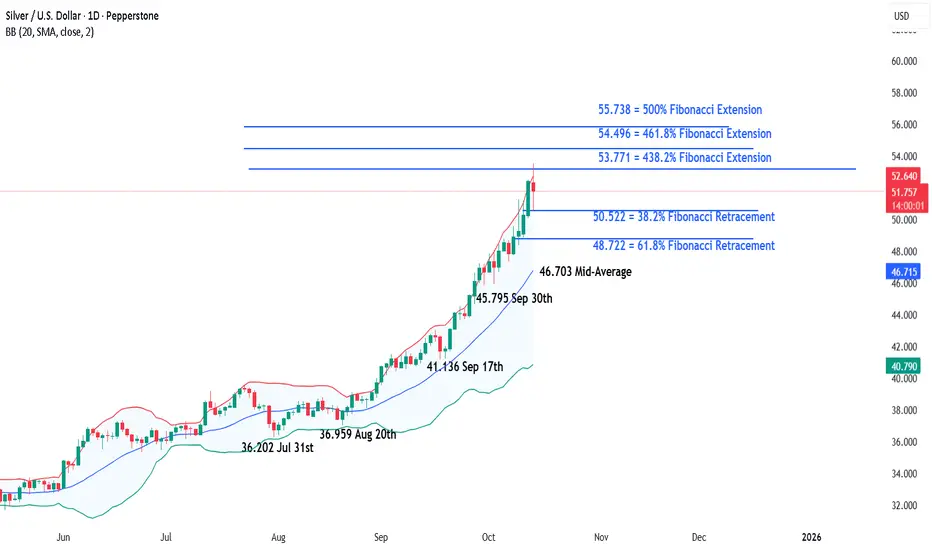
Technical Update: The Push Higher Continues:
It should always be remembered that traditional overbought signals are sometimes ignored while trending and sentiment measures remain strong. It’s a reminder that indicators like RSI or stochastics may flash caution, but price can continue to move higher if broader conditions support it.
Silver has defied overbought readings of late with a near-uninterrupted rally since the August lows. Despite repeated calls from some for a correction, price action has remained resilient, underscoring how strong trend and sentiment can override traditional ‘overbought’ conditions.
So, what are the tools that might be used to gauge the trending and sentiment condition of Silver’s recent moves?
From a sentiment standpoint, the chart above shows a bias toward larger, more frequent green positive candles, indicating consistent buying interest. Traders appear willing to pay higher prices despite the extended rally, which reflects positive sentiment. This pattern suggests confidence in the trend, with dips being viewed as opportunities rather than warnings.
From a trending perspective, Bollinger Bands have shown price remains above the rising mid-average, frequently touching the upper band, while the bands themselves are widening. This combination reflects upward momentum and positive price volatility, maintaining a constructive backdrop.
Silver’s current setup might suggest attempts at further price strength, but it’s no guarantee of continuation. Positive candles and price action above the rising mid-average, alongside widening Bollinger Bands may point to momentum behind the current move, but traders must also stay alert, watching candlestick signals and Bollinger band activity to assess the current trends sustainability.
This backdrop can of course shift quickly, so tracking key support and resistance levels is also vital to help spot possible emerging directional themes.
Possible Resistance Levels: .
The 53.771 level, marking the 438.2% Fibonacci extension, may now act as a key resistance point. So far, Tuesday’s push into new highs has stayed below this level on a closing basis, suggesting it might slow further upside and potentially ease the prevailing bullish trend and sentiment.
Monitoring how this 53.771 resistance level is defended on a closing basis may prove important this week. A sustained break above it could result in further attempts at upside toward 54.496, the 461.8% extension, even potentially 55.738, a level equal to the 500% extension.
Possible Support Levels:
Throughout the August to October advance, pullbacks have been shallow, typically lasting just one or two sessions, before buyers reasserted control. This pattern currently suggests that near-term weakness may continue to prove limited.
To suggest potential of a possible shift in trend, closing breaks below support levels would likely be required, marking a possible transition from short-term dips to the potential of a corrective phase in price.
The first support may be at 50.522, which is the 38.2% retracement. A close below this level could suggest a deeper correction risk, shifting trader focus toward 48.722, the 61.8% Fibonacci retracement and potentially even 46.703, which is equal to the rising Bollinger mid-average.
The material provided here has not been prepared accordance with legal requirements designed to promote the independence of investment research and as such is considered to be a marketing communication. Whilst it is not subject to any prohibition on dealing ahead of the dissemination of investment research, we will not seek to take any advantage before providing it to our clients.
Pepperstone doesn’t represent that the material provided here is accurate, current or complete, and therefore shouldn’t be relied upon as such. The information, whether from a third party or not, isn’t to be considered as a recommendation; or an offer to buy or sell; or the solicitation of an offer to buy or sell any security, financial product or instrument; or to participate in any particular trading strategy. It does not take into account readers’ financial situation or investment objectives. We advise any readers of this content to seek their own advice. Without the approval of Pepperstone, reproduction or redistribution of this information isn’t permitted.
XAGUSD H1 | Potential Bullish Continuation AheadXAG/USD is falling towards the buy entry which is a pullback support that aligns withthe 38.2% Fibonacci retracement and could bounce from this level to the upside.
Buy entry is at 47.61, which is a pullback support that aligns with the 38.2% Fibonacci retracement.
Stop loss is at 46.74, which is a pullback support that is slightly above the 78.6% Fibonacci retracement.
Take profit is at 49.46, which is aligns with the 161.8% Fibonacci extension.
High Risk Investment Warning
Trading Forex/CFDs on margin carries a high level of risk and may not be suitable for all investors. Leverage can work against you.
Stratos Markets Limited (tradu.com/uk ):
CFDs are complex instruments and come with a high risk of losing money rapidly due to leverage. 65% of retail investor accounts lose money when trading CFDs with this provider. You should consider whether you understand how CFDs work and whether you can afford to take the high risk of losing your money.
Stratos Europe Ltd (tradu.com/eu ):
CFDs are complex instruments and come with a high risk of losing money rapidly due to leverage. 66% of retail investor accounts lose money when trading CFDs with this provider. You should consider whether you understand how CFDs work and whether you can afford to take the high risk of losing your money.
Stratos Global LLC (tradu.com/en ):
Losses can exceed deposits.
Please be advised that the information presented on TradingView is provided to Tradu (‘Company’, ‘we’) by a third-party provider (‘TFA Global Pte Ltd’). Please be reminded that you are solely responsible for the trading decisions on your account. There is a very high degree of risk involved in trading. Any information and/or content is intended entirely for research, educational and informational purposes only and does not constitute investment or consultation advice or investment strategy. The information is not tailored to the investment needs of any specific person and therefore does not involve a consideration of any of the investment objectives, financial situation or needs of any viewer that may receive it. Kindly also note that past performance is not a reliable indicator of future results. Actual results may differ materially from those anticipated in forward-looking or past performance statements. We assume no liability as to the accuracy or completeness of any of the information and/or content provided herein and the Company cannot be held responsible for any omission, mistake nor for any loss or damage including without limitation to any loss of profit which may arise from reliance on any information supplied by TFA Global Pte Ltd.
The speaker(s) is neither an employee, agent nor representative of Tradu and is therefore acting independently. The opinions given are their own, constitute general market commentary, and do not constitute the opinion or advice of Tradu or any form of personal or investment advice. Tradu neither endorses nor guarantees offerings of third-party speakers, nor is Tradu responsible for the content, veracity or opinions of third-party speakers, presenters or participants.

Stop!Loss|Market View: SILVER🙌 Stop!Loss team welcomes you❗️
In this post, we're going to talk about the near-term outlook for SILVER ☝️
Potential trade setup:
🔔Entry level: 52.13310
💰TP: 47.21585
⛔️SL: 54.64486
"Market View" - a brief analysis of trading instruments, covering the most important aspects of the FOREX market.
👇 In the comments 👇 you can type the trading instrument you'd like to analyze, and we'll talk about it in our next posts.
💬 Description: Metals are likely to form new highs in the short term. Silver is expected to approach 50-51, with a reversal expected near this historical resistance level, but most likely not immediately. Manipulation toward 52-53 is not ruled out. The mid- and long-term priorities are currently in favor of selling. For this, a potential aggressive sell scenario is anticipated to occur near the 52-level. However, it is best to wait for a potential entry point near this price point.
Thanks for your support 🚀
Profits for all ✅
❗️ Updates on this idea can be found below 👇

Silver at critical resistance, is a great collapse next?Silver has a long history of dramatic price spikes, each coinciding with significant global macro events:
June 1980, the Hunt Brother’s squeeze sent silver parabolic before collapsing
March 2011, post Global Financial Crisis (GFC) stimulus + QE mania led to another blow off top
Present day, amidst chaotic politics and incomprehensible levels of debt price action is once again testing the same resistance zone around $50
This area has proven to be a multi-decade resistance. Each prior approach ended in a swift and brutal correction.
Technical analysis
Monthly chart: Price action has surged aggressively. 300% since the lows of 2020 to the $45-50 resistance band, mirroring the same vertical rallies of 1980 and 2011.
RSI: A long term descending RSI resistance line connects the 1980 and 2011 tops. Current RSI is once again colliding with this barrier, hinting at exhaustion.
Momentum: While silver is undeniably strong, history suggests the upside risk may be limited at these levels compared to the downside potential.
Risk reward breakdown
Upside potential: A clean breakout above $50 could open the door to a true price discovery phase possibly $60+ if silver enters a secular commodities super cycle.
Downside risk: Failure here would mimic the historic collapses:
1980: -90% drawdown
2011: -70% drawdown
A pullback to $25-30 would not be unusual, especially if macro liquidly tightens.
Trading strategy ideas:
Aggressive traders: Consider short setups or profit taking near the $50 resistance, with stops above $52-53 to manage risk.
Conservative traders: Wait for confirmation, either a monthly breakout or close above $50 (bullish) or a strong rejection signal.
Conclusion
Silver has once again like Gold reached historic levels. The risk/reward profile favours caution here on. History shows that vertical rallies into this level tend to end poorly for late longs. Unless silver breaks and holds above $50, the probability of a deep correction remains high.
Is it possible price action continues higher? Sure.
Is it probable? No.
Ww
