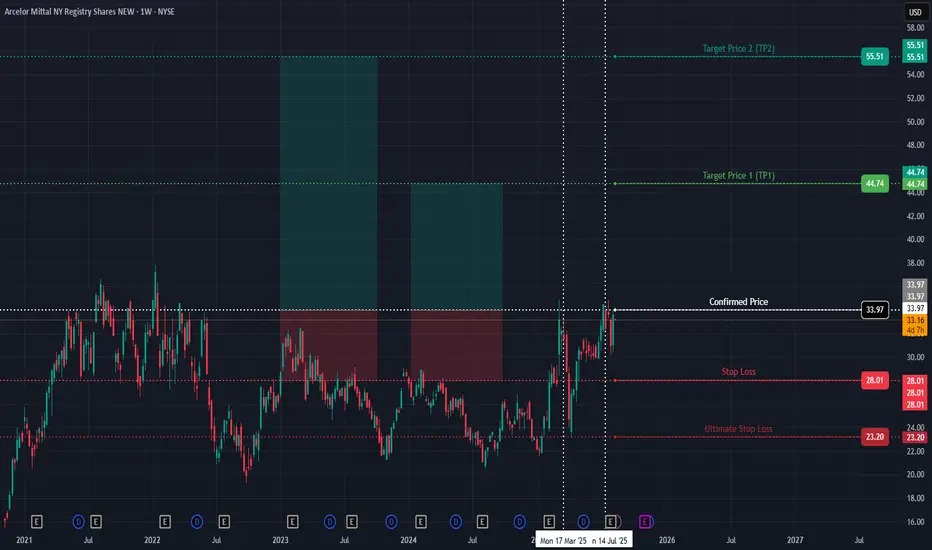
MT Stock Long Position Confirmed Monday 7/14/25Hello,
Ayrfolio trade ideas are based on weekly charts and momentum, so remember to be patient! No day trades here unless the stock soars up intraday! Today we’re covering:
STOCK SYMBOL: MT
POSITION: Long
TP1 Risk-Reward Ratio: 1.81
TP2 Risk-Reward Ratio: 3.61
Stop Loss: must wait AFTER daily ca
2.99 EUR
1.24 B EUR
57.73 B EUR
376.93 M
About ArcelorMittal SA
Sector
Industry
CEO
Aditya Mittal
Website
Headquarters
Luxembourg
Founded
2001
ISIN
LU1598757687
FIGI
BBG000DSJXF4
ArcelorMittal SA is a holding company, which engages in steelmaking and mining activities. It operates through the following business segments: NAFTA; Brazil; Europe; Africa and Commonwealth of Independent States (ACIS), and Mining. The NAFTA segment consists of flat products such as slabs, hot-rolled coil, cold-rolled coil, coated steel, and plate. The Brazil segment covers wire rod, bar and rebars, billets, blooms, and wire drawing. The Europe segment offers hot-rolled coil, cold-rolled coil, coated products, tinplate, plate, and slab. The ACIS segment produces a combination of flat, long, and tubular products. The Mining segment focuses on steel operations. The company was founded by Lakshmi Niwas Mittal in 1976 and is headquartered in Luxembourg.
Related stocks
ArcelorMittal : Getting stronger again!! Go for the best!ArcelorMittal, the world's leading steel and mining producer, present in 60 countries and with primary steel production facilities in 16 countries, presents a CLEARLY BULLISH technical outlook.
If we look at the H1 chart above, the trend is clearly bullish, as are its upper timeframes, H4, Daily, a

ArcelorMittal (MT) Stock Chart & Technical Analysis GraphWithin a 100K Account Balance the split on Trade & Risk Management = 1/10% - 1/20% margin as an Execution Range, to set up an Order Entry and select a per Trade on Average, to avoid any drawdown hit regarding to Stop Loss & to execute Risk on Management Specifics. Trail Stop efforts are a Focus of A

ARCELOR MITTALFirst of all, I don't like Spanish stocks at all, but hey, a client has bought stocks at the current price and I gave him the following analysis.
We would have to be consistent even though it is respecting the average, and position a lower operation to average in case the asset once again seeks the

ArcelorMittal Long opportunityNice long opportunity on #ArcelorMittal based on historical trendline and current positive candlestick pattern.

Position #1 – ArcelorMittal SA – 19.07.2023LIMIT BUY @ 24.80 EUR
TP @ 30.50 EUR (22.98%)
SL @ 23.00 EUR (-7.26%)
Technical Analysis
This stock has formed a Continuation Wedge pattern (Bullish), providing a target price for the intermediate-term in the range of 30.50 to 32.00, the Momentum oscillator has crossed above 0, thereby signaling a

MT technical Breakdown on watchIf retail earnings come in negative this stock could see further weakness.
A head & shoulders pattern has triggered which means we have to be aware of continued weakness to the downside.
A close above the neckline negates the pattern but being below key moving averages does not display signs of

ARCELORMITTAL MTS Bullish DivergenceArcelorMittal has activated a divergence with both MACD and RSI and with target price at 30.985€. I'd set the stop loss below 19.42€ because the structure would get inactivated. This is a short term structure but just as a reminder this company has a double bottom activated with target price to 54.1

MT to break higher?ArcelorMittal - 30d expiry - We look to Buy a break of 26.51 (stop at 25.56)
Daily signals are bullish.
26.47 has been pivotal.
Our short term bias remains positive.
The bias is to break to the upside.
There is no clear indication that the upward move is coming to an end.
We are trading withi

$MT with a Bullish outlook following its earnings #Stocks The PEAD projected a Bullish outlook for $MT after a Positive Under reaction following its earnings release placing the stock in drift A with an expected accuracy of 75%.

See all ideas
Summarizing what the indicators are suggesting.
Neutral
SellBuy
Strong sellStrong buy
Strong sellSellNeutralBuyStrong buy
Neutral
SellBuy
Strong sellStrong buy
Strong sellSellNeutralBuyStrong buy
Neutral
SellBuy
Strong sellStrong buy
Strong sellSellNeutralBuyStrong buy
An aggregate view of professional's ratings.
Neutral
SellBuy
Strong sellStrong buy
Strong sellSellNeutralBuyStrong buy
Neutral
SellBuy
Strong sellStrong buy
Strong sellSellNeutralBuyStrong buy
Neutral
SellBuy
Strong sellStrong buy
Strong sellSellNeutralBuyStrong buy
Displays a symbol's price movements over previous years to identify recurring trends.
MT5829552
ArcelorMittal SA 6.0% 17-JUN-2034Yield to maturity
—
Maturity date
Jun 17, 2034
MT4858475
ArcelorMittal SA 4.25% 16-JUL-2029Yield to maturity
—
Maturity date
Jul 16, 2029
MT5829553
ArcelorMittal SA 6.35% 17-JUN-2054Yield to maturity
—
Maturity date
Jun 17, 2054
XS295418184
ArcelorMittal SA 3.125% 13-DEC-2028Yield to maturity
—
Maturity date
Dec 13, 2028
ARRA
ArcelorMittal SA 7.0% 15-OCT-2039Yield to maturity
—
Maturity date
Oct 15, 2039
US3938LBE3
ArcelorMittal SA 6.55% 29-NOV-2027Yield to maturity
—
Maturity date
Nov 29, 2027
XS295418303
ArcelorMittal SA 3.5% 13-DEC-2031Yield to maturity
—
Maturity date
Dec 13, 2031
US3938LAS3
ArcelorMittal SA 6.75% 01-MAR-2041Yield to maturity
—
Maturity date
Mar 1, 2041
ARRF
ArcelorMittal SA 1.75% 19-NOV-2025Yield to maturity
—
Maturity date
Nov 19, 2025
XS253706074
ArcelorMittal SA 4.875% 26-SEP-2026Yield to maturity
—
Maturity date
Sep 26, 2026
US3938LBA1
ArcelorMittal SA 4.55% 11-MAR-2026Yield to maturity
—
Maturity date
Mar 11, 2026
See all ARRD bonds
Curated watchlists where ARRD is featured.

Frequently Asked Questions
The current price of ARRD is 27.95 EUR — it has decreased by −3.51% in the past 24 hours. Watch ArcelorMittal SA stock price performance more closely on the chart.
Depending on the exchange, the stock ticker may vary. For instance, on XETR exchange ArcelorMittal SA stocks are traded under the ticker ARRD.
ARRD stock has fallen by −5.21% compared to the previous week, the month change is a 0.44% rise, over the last year ArcelorMittal SA has showed a 31.84% increase.
We've gathered analysts' opinions on ArcelorMittal SA future price: according to them, ARRD price has a max estimate of 40.18 EUR and a min estimate of 26.81 EUR. Watch ARRD chart and read a more detailed ArcelorMittal SA stock forecast: see what analysts think of ArcelorMittal SA and suggest that you do with its stocks.
ARRD reached its all-time high on Jan 12, 2022 with the price of 33.01 EUR, and its all-time low was 5.99 EUR and was reached on Mar 19, 2020. View more price dynamics on ARRD chart.
See other stocks reaching their highest and lowest prices.
See other stocks reaching their highest and lowest prices.
ARRD stock is 2.97% volatile and has beta coefficient of 1.35. Track ArcelorMittal SA stock price on the chart and check out the list of the most volatile stocks — is ArcelorMittal SA there?
Today ArcelorMittal SA has the market capitalization of 20.91 B, it has decreased by −2.63% over the last week.
Yes, you can track ArcelorMittal SA financials in yearly and quarterly reports right on TradingView.
ARRD net income for the last half-year is 2.38 B EUR, while the previous report showed −95.15 M EUR of net income which accounts for 2.60 K% change. Track more ArcelorMittal SA financial stats to get the full picture.
ArcelorMittal SA dividend yield was 2.15% in 2024, and payout ratio reached 30.60%. The year before the numbers were 1.81% and 46.01% correspondingly. See high-dividend stocks and find more opportunities for your portfolio.
As of Sep 3, 2025, the company has 125.42 K employees. See our rating of the largest employees — is ArcelorMittal SA on this list?
EBITDA measures a company's operating performance, its growth signifies an improvement in the efficiency of a company. ArcelorMittal SA EBITDA is 4.41 B EUR, and current EBITDA margin is 9.70%. See more stats in ArcelorMittal SA financial statements.
Like other stocks, ARRD shares are traded on stock exchanges, e.g. Nasdaq, Nyse, Euronext, and the easiest way to buy them is through an online stock broker. To do this, you need to open an account and follow a broker's procedures, then start trading. You can trade ArcelorMittal SA stock right from TradingView charts — choose your broker and connect to your account.
Investing in stocks requires a comprehensive research: you should carefully study all the available data, e.g. company's financials, related news, and its technical analysis. So ArcelorMittal SA technincal analysis shows the neutral today, and its 1 week rating is buy. Since market conditions are prone to changes, it's worth looking a bit further into the future — according to the 1 month rating ArcelorMittal SA stock shows the buy signal. See more of ArcelorMittal SA technicals for a more comprehensive analysis.
If you're still not sure, try looking for inspiration in our curated watchlists.
If you're still not sure, try looking for inspiration in our curated watchlists.