DAX40 - Buy trade Idea 📊 GER40 (Germany 40) – 1H Analysis
I’m currently watching a potential bullish continuation setup forming on the Germany 40 index.
🔎 Key Observation:
1. Support Zone: Price has tested the 24,240 – 24,260 support area multiple times (highlighted with circles), showing strong demand. Each rejection created long wicks, signaling buying pressure.
2. Bullish Divergence: On RSI (bottom panel), we can see higher lows forming while price action made lower lows → a classic bullish divergence. This often indicates weakening bearish momentum and a potential reversal to the upside.
3. Falling Trendline: A descending resistance line is capping the recent lower highs. A clean breakout above this line could trigger bullish momentum.
4. Projected Move:
• First, I expect a potential retest of the 24,240 – 24,260 support zone.
• The upside target is the 24,480 – 24,520 resistance zone (grey box), where sellers previously stepped in.
⚠️ Invalidation:
If price breaks and closes below 24,200, this setup weakens as it would invalidate the support structure and divergence.
DAX trade ideas

Long DAXeven DAX in bearish structure, i see similar pattern with yesterday, after taken the low it goes long, waiting for candle close bullsih to take long

Bullish bounce off?DAX40 (DE40) has bounced off the pivot which has been identified as a pullback support, and could potentially rise to the 1st resistance, which is a swing high resistance.
Pivot: 24,271.20
1st Support: 24,027.32
1st Resistance: 24,626.98
Risk Warning:
Trading Forex and CFDs carries a high level of risk to your capital and you should only trade with money you can afford to lose. Trading Forex and CFDs may not be suitable for all investors, so please ensure that you fully understand the risks involved and seek independent advice if necessary.
Disclaimer:
The above opinions given constitute general market commentary, and do not constitute the opinion or advice of IC Markets or any form of personal or investment advice.
Any opinions, news, research, analyses, prices, other information, or links to third-party sites contained on this website are provided on an "as-is" basis, are intended only to be informative, is not an advice nor a recommendation, nor research, or a record of our trading prices, or an offer of, or solicitation for a transaction in any financial instrument and thus should not be treated as such. The information provided does not involve any specific investment objectives, financial situation and needs of any specific person who may receive it. Please be aware, that past performance is not a reliable indicator of future performance and/or results. Past Performance or Forward-looking scenarios based upon the reasonable beliefs of the third-party provider are not a guarantee of future performance. Actual results may differ materially from those anticipated in forward-looking or past performance statements. IC Markets makes no representation or warranty and assumes no liability as to the accuracy or completeness of the information provided, nor any loss arising from any investment based on a recommendation, forecast or any information supplied by any third-party.

Pullback tradeThe price has been on a bullish trend from last week followed by a pullback, which is now a falling channel pattern and a trendline break
we initially saw a breakout then a pullback, now the price looks to make a higher high and continue is bullish run
WE ONLY TRADE PULLBACKS

GER 40 getting a macro lift today.Markets got a boost today on peace talk progress between Ukraine, the U.S., and Europe.
Oil dropped, easing pressure on German industrials — and DAX followed higher.
Risk-on flows showing up again.

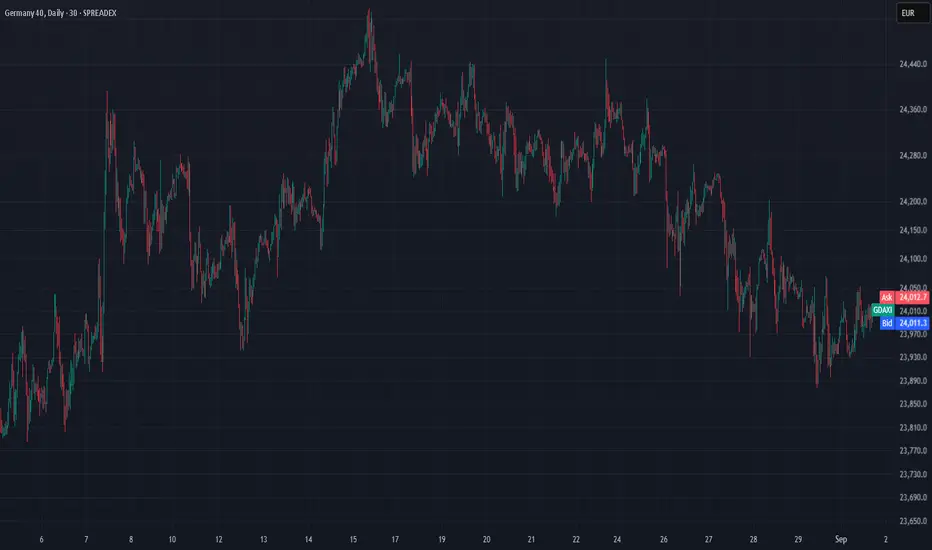
Weekly Technical Analysis- Germany 40 is range-bound at 23,938, under its VWAP of 24,213. RSI at 41 signals weaker momentum. Support at 23,00 is being tested while resistance is 24,524.
- UK 100 remains bullish but has pulled back from record highs down to its VWAP, trading at 9,193. RSI at 50 shows neutral momentum. Support is 9,042, resistance is 9,364.
- Wall Street has entered a new bullish trend and is consolidating under record highs, last at 45,550 above its VWAP 44,948. RSI at 64 leans bullish. Support is 43,934, resistance 45,962.
- Brent Crude is still in a choppy range, at 6,745 the price is back above its VWAP of 6,656. RSI at 51 reflects neutral momentum. Support stands at 6,490, resistance at 6,822.
- Gold has broken higher, trading at 3,447 above VWAP 3,368 and near the top of its 4-month range. RSI at 68 demonstrates the fresh bullish momentum. Support is 3,293, resistance is being
tested at 3,450.
- EUR/USD is testing the highs, trading at 1.1692 above VWAP 1.1692. RSI at 54 suggests balanced momentum. Support is 1.1596, resistance 1.1735.
- GBP/USD is consolidating in an extended correction of a bullish trend, trading at 1.3505 near VWAP 1.3500. RSI at 53 signals a stable tone. Support is 1.3405, resistance is 1.3581.
- USD/JPY stays range-bound at 147.00, now just below the VWAP at 147.45. RSI at 47 reflects a neutral outlook. Support is 146.60, resistance 148.27.
DAX: Will Go Down! Short!
My dear friends,
Today we will analyse DAX together☺️
The recent price action suggests a shift in mid-term momentum. A break below the current local range around 24,174.74 will confirm the new direction downwards with the target being the next key level of 24,103.39 and a reconvened placement of a stop-loss beyond the range.
❤️Sending you lots of Love and Hugs❤️
DAX is forming an interesting short-term patternLooking at the technical picture of DAX, we can see that the German index seems to be preparing for a breakout. Maybe Powell's speech could be that catalyst? Let's find out.
XETR:DAX
MARKETSCOM:DE30
Let us know what you think in the comments below.
Thank you.
75.2% of retail investor accounts lose money when trading CFDs with this provider. You should consider whether you understand how CFDs work and whether you can afford to take the high risk of losing your money. Past performance is not necessarily indicative of future results. The value of investments may fall as well as rise and the investor may not get back the amount initially invested. This content is not intended for nor applicable to residents of the UK. Cryptocurrency CFDs and spread bets are restricted in the UK for all retail clients.

DAX Corrective pullback supported at 23790The DAX remains in a bullish trend, with recent price action indicating a potential oversold rally within the broader uptrend.
Support Zone: 23790 – a key level from previous consolidation. Price is currently testing or approaching this level.
A bullish rebound from 23790 would confirm ongoing upside momentum, with potential targets at:
24540 – initial resistance
24670 – psychological and structural level
24980 – extended resistance on the longer-term chart
Bearish Scenario:
A confirmed break and daily close below 23790 would weaken the bullish outlook and suggest deeper downside risk toward:
23610 – minor support
23400 – stronger support and potential demand zone
Outlook:
Bullish bias remains intact while the FTSE holds above 23790. A sustained break below this level could shift momentum to the downside in the short term.
This communication is for informational purposes only and should not be viewed as any form of recommendation as to a particular course of action or as investment advice. It is not intended as an offer or solicitation for the purchase or sale of any financial instrument or as an official confirmation of any transaction. Opinions, estimates and assumptions expressed herein are made as of the date of this communication and are subject to change without notice. This communication has been prepared based upon information, including market prices, data and other information, believed to be reliable; however, Trade Nation does not warrant its completeness or accuracy. All market prices and market data contained in or attached to this communication are indicative and subject to change without notice.

DAX: Strong Growth Ahead! Long!
My dear friends,
Today we will analyse DAX together☺️
The recent price action suggests a shift in mid-term momentum. A break above the current local range around 24,246.92 will confirm the new direction upwards with the target being the next key level of 24,297.37 and a reconvened placement of a stop-loss beyond the range.
❤️Sending you lots of Love and Hugs❤️
DAX bullish sideways consolidation resistance at 24540The DAX remains in a bullish trend, with recent price action indicating a potential oversold rally within the broader uptrend.
Support Zone: 23790 – a key level from previous consolidation. Price is currently testing or approaching this level.
A bullish rebound from 23790 would confirm ongoing upside momentum, with potential targets at:
24540 – initial resistance
24670 – psychological and structural level
24980 – extended resistance on the longer-term chart
Bearish Scenario:
A confirmed break and daily close below 23790 would weaken the bullish outlook and suggest deeper downside risk toward:
23610 – minor support
23400 – stronger support and potential demand zone
Outlook:
Bullish bias remains intact while the FTSE holds above 23790. A sustained break below this level could shift momentum to the downside in the short term.
This communication is for informational purposes only and should not be viewed as any form of recommendation as to a particular course of action or as investment advice. It is not intended as an offer or solicitation for the purchase or sale of any financial instrument or as an official confirmation of any transaction. Opinions, estimates and assumptions expressed herein are made as of the date of this communication and are subject to change without notice. This communication has been prepared based upon information, including market prices, data and other information, believed to be reliable; however, Trade Nation does not warrant its completeness or accuracy. All market prices and market data contained in or attached to this communication are indicative and subject to change without notice.

Technical Analysis WeeklyGermany 40 is range-bound at 24,328, near its VWAP of 24,087. RSI at 55 indicates stable momentum. Support is 23,518 while resistance is 24,656.
UK 100 remains bullish but consolidating, trading at 9,140, slightly above VWAP 9,129. RSI at 56 reflects steady upward bias. Support is 9,071, resistance is 9,192.
Wall Street holds a bullish trend but is correcting, last at 44,942 near VWAP 44,364. RSI at 59 leans bullish. Support is 43,434, resistance 45,295.
Brent Crude is still in a choppy range, down to 6,520, now well below VWAP 6,761. RSI at 38 signals bearish momentum. Support stands at 6,283, resistance at 7,238.
Gold remains sideways and in the middle of its large range at 3,337, near VWAP 3,340. RSI at 47 reflects neutral tone. Support is 3,285, resistance 3,415.
EUR/USD has corrected within its uptrend and is now testing the highs, at 1.1675 above VWAP 1.1618. RSI at 53 suggests balanced momentum. Support is 1.1451, resistance 1.1784.
GBP/USD is tracking just below recent highs in a tight pullback, trading at 1.3539 above VWAP 1.3410. RSI at 58 signals bullish momentum. Support is 1.3170, resistance 1.3648.
USD/JPY stays range-bound at 147.87, aligned with VWAP 147.9. RSI at 53 reflects a neutral outlook. Support is 146.00, resistance 149.60.
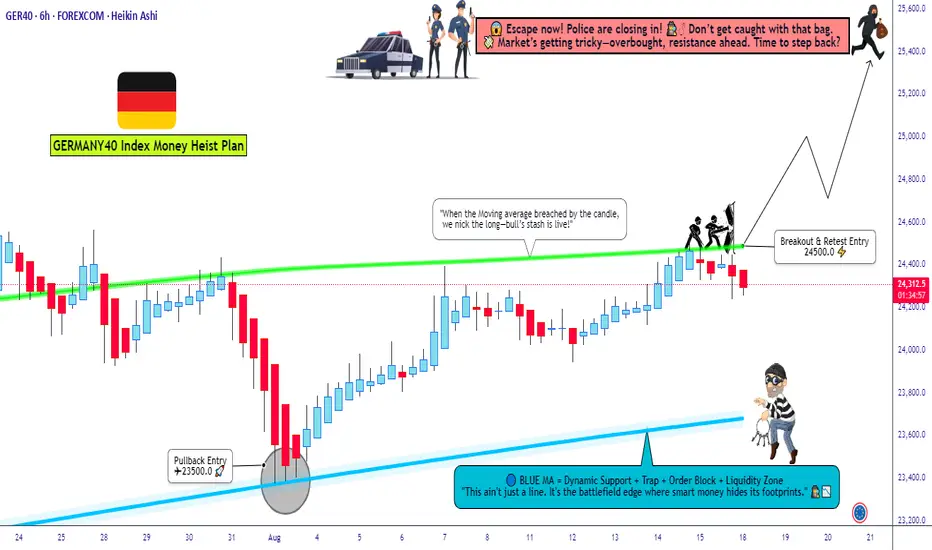
Breakout Alert! Germany 40 Targeting 25400 – Join the Robbery⚡GERMANY 40 INDEX CFD HEIST PLAN⚡
💸 Thief Trader Robbery Blueprint 💸
🎭 Dear Ladies & Gentleman, my Thief OG’s 🕶️🕵️♂️,
Welcome to another market heist – this time we’re targeting the GERMANY 40 INDEX CFD vault!
🚀 Plan: Bullish Breakout Robbery
The lock is weak around 24,500.0 ⚡ – once that vault door cracks open, we raid in style with layer entries.
🔑 Thief Layer Entry Method:
📍 First entry on breakout @ 24,500.0
📍 Layer extra buy limits @ 24,400.0 / 24,300.0 / 24,200.0 (stack your orders like pro robbers 😈)
👉 You can increase your layers depending on your appetite for stolen cash 💰.
🛑 Stop Loss (SL):
This is the Thief SL → @ 24,000.0 after breakout confirmation.
📌 Adjust your SL with caution, OG’s, depending on your risk & strategy. Protect the loot at all costs 🏴☠️.
🎯 Target (TP):
⚠️ Police barricade spotted @ 25,500.0 🚔🚨
👉 Escape before the sirens – cash out at 25,400.0 and vanish with the bags 🎒💸.
🏆 Thief Trader Reminder
📌 Stick to the layering strategy – multiple entries spread like a thief’s toolkit.
📌 Manage risk like a pro robber – don’t get caught with greedy hands.
📌 Escape clean – profit secured before the market traps you!
🔥💎 Support the Thief Gang by smashing that Boost Button 💥
Let’s keep robbing the markets together – smooth, stylish, and profitable.
Every heist, every day – Thief Trading Style. 🏆🕶️💰🚀

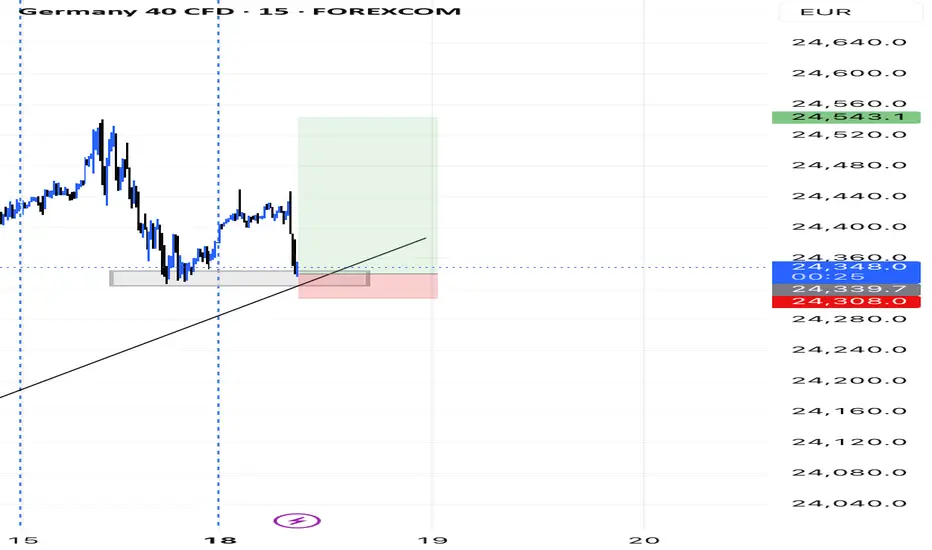
Buy Plan (DE40) Germany📈 Buy Plan (DE40)
Entry
After the breakout, price closed above resistance.
This confirms a buy opportunity.
Stop Loss (SL) 🚀
Placed below the recent strong support zone.
Take Profit (TP) 😘
Aiming for the next major resistance zone.
Risk to Reward
High reward compared to risk (around 1:3 or more).
Mindset
Patience is key — this is a swing setup, meant to be held.

GER30 H4 | Bearish dropGER30 has rejected the sell entry at 24,549.50, which is a multi swing high resistance that is slightly below the 61.8% Fibonacci projection and could drop from this level to the downside.
Sell entry is at 24,549.50, which is a multi swing high resistance that is slightly below the 61.8% Fibonacci projection.
Stop loss is at 24,987.98, which lines up with the 127.2% Fibonacci extension,
Take profit is at 23,987.27, whichis an overlap support that aligns witht he 50% Fibonacci retracement.
High Risk Investment Warning
Trading Forex/CFDs on margin carries a high level of risk and may not be suitable for all investors. Leverage can work against you.
Stratos Markets Limited (tradu.com ):
CFDs are complex instruments and come with a high risk of losing money rapidly due to leverage. 65% of retail investor accounts lose money when trading CFDs with this provider. You should consider whether you understand how CFDs work and whether you can afford to take the high risk of losing your money.
Stratos Europe Ltd (tradu.com ):
CFDs are complex instruments and come with a high risk of losing money rapidly due to leverage. 66% of retail investor accounts lose money when trading CFDs with this provider. You should consider whether you understand how CFDs work and whether you can afford to take the high risk of losing your money.
Stratos Global LLC (tradu.com ):
Losses can exceed deposits.
Please be advised that the information presented on TradingView is provided to Tradu (‘Company’, ‘we’) by a third-party provider (‘TFA Global Pte Ltd’). Please be reminded that you are solely responsible for the trading decisions on your account. There is a very high degree of risk involved in trading. Any information and/or content is intended entirely for research, educational and informational purposes only and does not constitute investment or consultation advice or investment strategy. The information is not tailored to the investment needs of any specific person and therefore does not involve a consideration of any of the investment objectives, financial situation or needs of any viewer that may receive it. Kindly also note that past performance is not a reliable indicator of future results. Actual results may differ materially from those anticipated in forward-looking or past performance statements. We assume no liability as to the accuracy or completeness of any of the information and/or content provided herein and the Company cannot be held responsible for any omission, mistake nor for any loss or damage including without limitation to any loss of profit which may arise from reliance on any information supplied by TFA Global Pte Ltd.
The speaker(s) is neither an employee, agent nor representative of Tradu and is therefore acting independently. The opinions given are their own, constitute general market commentary, and do not constitute the opinion or advice of Tradu or any form of personal or investment advice. Tradu neither endorses nor guarantees offerings of third-party speakers, nor is Tradu responsible for the content, veracity or opinions of third-party speakers, presenters or participants.

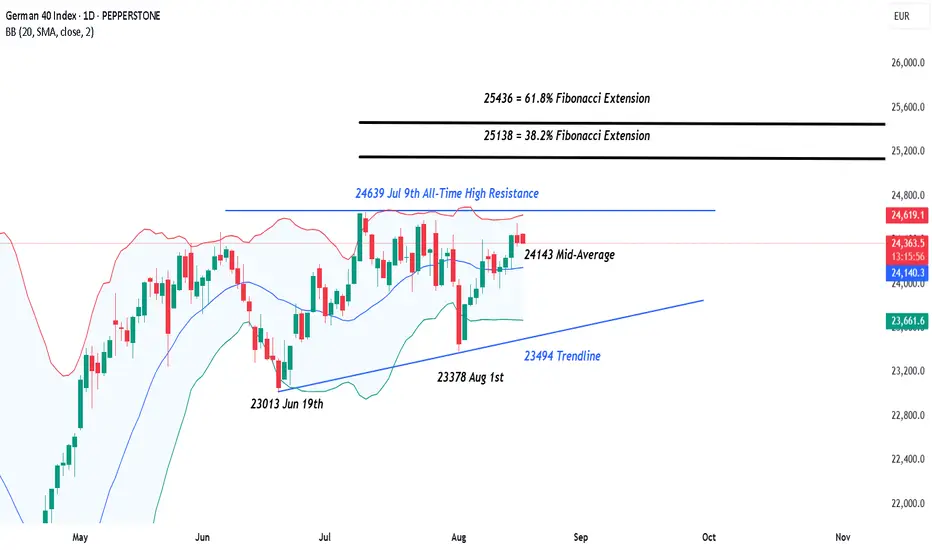
Germany 40 Index – Ukraine’s Future and All-Time Highs in FocusThe Germany 40 index registered its last record high at 23639 on July 9th and since that date has struggled to regain the upside momentum that took it there, with general sentiment towards European indices taking a dip after the EU agreed to a trade deal imposing 15% tariffs on exports to the US, the ECB decided to pause cutting interest rates to assess incoming economic growth and inflation data, and Q2 earnings from European corporates disappointed when measured against analyst expectations.
However, things have started to improve in August, with the Germany 40 experiencing a rally of 5% from its August 1st lows of 23378 to last Friday’s highs at 24544. So, what’s changed? , well general risk sentiment has been boosted by increased trader hopes of a Federal Reserve interest rate cut in September, and perhaps more importantly for European indices, and the Germany 40 in particular, anticipation that last Friday’s (August 15th) Alaskan summit between President Trump and Russian President Putin could be the first tentative step to agreeing an extended ceasefire in Ukraine, potentially even a peace agreement.
Early trading in European indices this morning has reflected guarded optimism that progress is being made regarding Ukraine, with the Germany 40 index currently up 0.2% at 24,418 (0630 BST).
Whether this move can extend further, may now depend on the outcome of a meeting scheduled for later today in Washington between President Trump, Ukrainian President Zelenskiy and key European leaders, including German Chancellor Merz, UK PM Starmer and French President Macron.
According to Bloomberg, talks are expected to focus on US security guarantees, territorial issues and continued support for Ukraine in its defence against Russian aggression.
Technical Update: Focus on All-Time Highs
Since early June, the Germany 40 index has failed to establish a sustainable trend, be it to the up or downside. As the chart below shows, this has resulted in sideways price activity between resistance marked by 24639, the July 9th all-time high and support offered by the uptrend connecting the 23013 June 19th and 23378 August 1st lows. This trendline currently stands at 23494.
This type of sideways activity can extend over a prolonged period, with only a closing break above resistance or below the support levels suggesting a more prolonged phase of price movement, in the direction of the break.
However, with the on-going discussions regarding Ukraine increasing the potential for Germany 40 index volatility, traders may be asking if a breakout from the current range is possibly about to materialise, and if so, where the next support or resistance levels may then stand.
Possible Resistance Levels:
Having already found selling interest at 24639 and it being the current all-time price high, there is a possibility that if strength re-emerges, sellers may once again be found at this level. As such, 24639 could be a resistance focus for traders in the near term.
While not a guarantee of price strength, daily closes above 24639, could reinforce the upside potential for the Germany 40 index. If confirmed breaks materialise, prices may continue their advance to the next possible resistance at 25138, which is the 38.2% Fibonacci extension.
Potential for a further phase of price strength could in turn be suggested by closing breaks above this 25138 level, which may bring the higher resistance at 25436 (61.8% extension) into play.
Potential Support Levels:
To the downside, during periods of price strength, the Bollinger mid-average can be a potential support. For the Germany 40 index, this currently stands at 24134.
Should prices manage closing breaks below 24134, it may prompt further attempts to extend any weakness to test the 23494 trendline support, which may prove to be a more important focus for traders.
With this 23494 level representing the lower extremes of the current sideways range, it might be closes below here that prompt further weakness towards 23378, the August 1st low, possibly even 23013, a support level equal to the June 19th extreme.
The material provided here has not been prepared accordance with legal requirements designed to promote the independence of investment research and as such is considered to be a marketing communication. Whilst it is not subject to any prohibition on dealing ahead of the dissemination of investment research, we will not seek to take any advantage before providing it to our clients.
Pepperstone doesn’t represent that the material provided here is accurate, current or complete, and therefore shouldn’t be relied upon as such. The information, whether from a third party or not, isn’t to be considered as a recommendation; or an offer to buy or sell; or the solicitation of an offer to buy or sell any security, financial product or instrument; or to participate in any particular trading strategy. It does not take into account readers’ financial situation or investment objectives. We advise any readers of this content to seek their own advice. Without the approval of Pepperstone, reproduction or redistribution of this information isn’t permitted.
GER40 Holding Despite Macro — Here's the Level I'm WatchingGER40 holding strong despite weak local data. Most names here earn globally — Siemens, SAP, the heavy hitters. With €1T stimulus and rate cuts likely, bulls still have fuel.
I’m watching 24,260.5 — if we flip bullish into that early week, I’m in.
Invalidation at 23,949.4 — clean stop.
If that breaks, mid-range likely gets hunted.
Risk-on, but solid RR if it clicks. Simple plan.
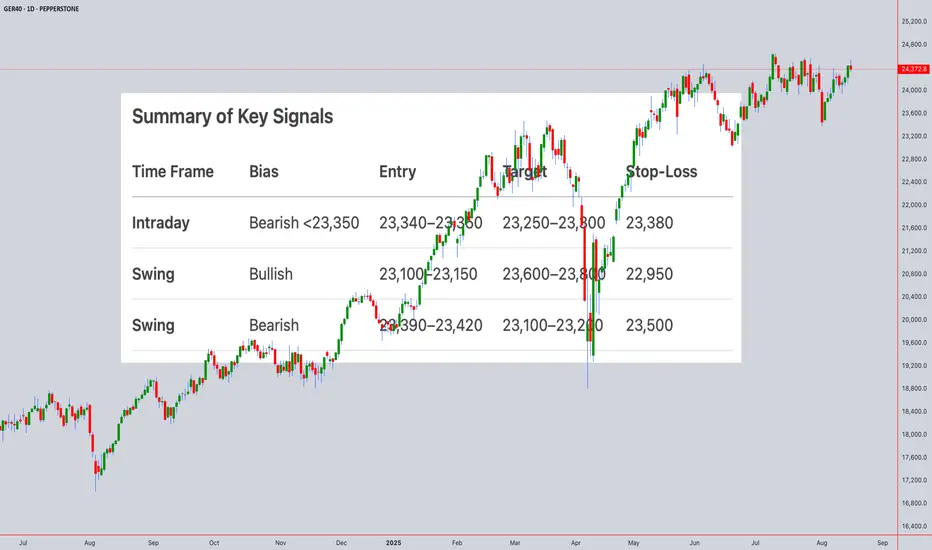
Technical Analysis for GER40 (DAX) Closing Price: 23,372.80 (15th Aug 2025, 11:50 PM UTC+4)
Analysis Methods: Japanese Candlesticks, Harmonic Patterns (ABCD, M/W), Elliott Wave, Wyckoff, Gann Theory (Time/Square of 9/Angles), Ichimoku, RSI, Bollinger Bands, VWAP, Moving Averages (MA/EMA/SMA/WMA).
---------------------------------------------------------------------------------------------
1. Long-Term Trend (Weekly/Monthly)
Elliott Wave:
GER40 is likely in Wave 3 of a broader bull cycle (Wave 1 peak: 22,800, Wave 2 dip to 21,500).
Wave 3 Target: 24,000–24,500 (1.618 extension of Wave 1).
Gann Price Forecasting:
Square of 9: √23,372.80 ≈ 152.90 →
Resistance: 153² = 23,409 (immediate), 154² = 23,716 (swing target).
Support: 152² = 23,104 (daily pivot), 151² = 22,801 (Wyckoff accumulation zone).
Ichimoku (Monthly):
Tenkan/Kijun: Bullish (Tenkan: 22,900 > Kijun: 22,400).
Cloud: Price above thick Senkou Span (22,000–22,500) – structural bullishness.
Moving Averages:
Weekly SMA(100): 22,200 (major support).
Swing Outlook: Bullish. Wave 3 rally targets 24,000–24,500.
2. Medium-Term Swing (4H/Daily)
Harmonic Patterns:
Bearish ABCD on Daily:
A: 23,800 → B: 23,100 → C: 23,550 → D: 23,380–23,420 (1.272 BC extension).
Bullish Crab (W Pattern) forming near 23,100 (0.886 XA retracement).
Wyckoff Phase:
Testing at 23,400:
Upthrust rejection at 23,450 (15th Aug) on low volume.
Spring potential near 23,100 (accumulation signal).
Gann Theory:
Time Window: Aug 18–20 (Square of 9 date cluster) for breakout/reversal.
Price-Time Squaring: 23,372 aligns with Aug 15 – consolidation expected.
Gann Angle: 1x1 angle at 23,300 – close below accelerates selling.
Indicators:
RSI(14) + Bollinger Bands (Daily):
RSI: 64 (neutral, no divergence).
Price testing upper BB(20,2) at 23,450 – expansion hints at volatility.
VWAP (Weekly): 23,250 (swing support).
Swing Trade Setup:
Short near 23,400 (ABCD target) → Target 23,100. Stop-loss: 23,500.
Long near 23,100 (Crab + Gann 151² support) → Target 23,800. Stop-loss: 22,950.
3. Intraday Outlook (5M–4H)
Key Levels:
Resistance: 23,400 (Gann 1x1), 23,450 (weekly high).
Support: 23,300 (VWAP), 23,200 (Ichimoku cloud), 23,100 (psychological).
Indicators:
Ichimoku (1H):
Tenkan: 23,360, Kijun: 23,330 → Price above both (short-term bullish).
Cloud: Bullish (23,280–23,320) – strong support zone.
RSI + Bollinger Bands (4H):
RSI(14): 58 (neutral).
Price near mid-BB(20,2): 23,350 – break below signals bearish momentum.
VWAP + MAs:
VWAP: 23,340 (intraday pivot).
EMA(50): 23,310 (dynamic support).
Candlestick Patterns:
4H Shooting Star at 23,450 (15th Aug) → Bearish reversal confirmed.
1H Bearish Engulfing below 23,380 – adds downside pressure.
Gann Intraday Squaring:
Time Cycle: 8:00–10:00 AM CET (European open) for volatility.
Price Harmony: Close below 23,350 targets 23,300 → 23,250.
Intraday Trade Plan:
Sell below 23,350 → Target 23,300 (VWAP) → 23,250 (Ichimoku cloud).
Buy above 23,400 only with RSI <60 → Target 23,450.
Stop-Loss: 25–30 points risk.
Summary of Key Signals
Time Frame Bias Entry Target Stop-Loss
Intraday Bearish <23,350 23,340–23,350 23,250–23,300 23,380
Swing Bullish 23,100–23,150 23,600–23,800 22,950
Swing Bearish 23,390–23,420 23,100–23,200 23,500
Critical Events Ahead:
Gann Reversal Window: Aug 18–20 (watch for Eurozone CPI/GDP data).
Daily Close >23,450 invalidates bearish ABCD and targets 23,716.
Risk Note: GER40 is sensitive to EU political/energy risks. Use tight stops during news events.
Disclaimer: Technical analysis is probabilistic and based on historical patterns. Fundamental drivers (e.g., ECB policy, German industrial data) may override technical signals. Always use risk management.
For those interested in further developing their trading skills based on these types of analyses, consider exploring the mentoring program offered by Shunya dot Trade . (world wide web shunya dot trade)
I welcome your feedback on this analysis, as it will inform and enhance my future work.
Regards,
Shunya.Trade
world wide web shunya dot trade
⚠️ Disclaimer: This post is educational content and does not constitute investment advice, financial advice, or trading recommendations. The views expressed here are based on technical analysis and are shared solely for informational purposes. The stock market is subject to risks, including capital loss, and readers should exercise due diligence before investing. We do not take responsibility for decisions made based on this content. Consult a certified financial advisor for personalized guidance.
German / DEU40 / GER 40 - Heading SouthThe DAX (GER40) is hovering just around 24500 – not far from recent highs – but momentum is fading and Friday’s typical “profit-taking weakness” is already setting in.
From a technical perspective, the index is stuck near VWAP with flat RSI and decreasing volume. Price has failed to convincingly break higher this week and is starting to roll over. Buyers look tired, and Friday is not usually their strongest day.
Fundamentally, things aren’t looking too solid either:
- European data continues to underwhelm.
- Global risk sentiment is shaky as everyone waits for potential fallout from the Trump–Putin meeting today.
- Inflation ghosts are creeping back in, and central banks remain as noncommittal as ever.
Conclusion for me:
I’m leaning short into into the day. If we start slipping below 24,400 with volume, I expect some acceleration.
T1: 24,410
T2: 24,300
T3: 24,100
The one unpredictable variable? Again - The world's leaders. Their random decisions can obliterate any setup in seconds. Markets follow structure... until a politician wakes up and chooses violence. Today is a special day with the upcoming Meeting - Be careful. On the other hand, - one negative news regarding this upcoming event can nuke all the high expectations that are already priced in, which, in my opinion, strenghtens this trade!
No trading advice – just how I see it.

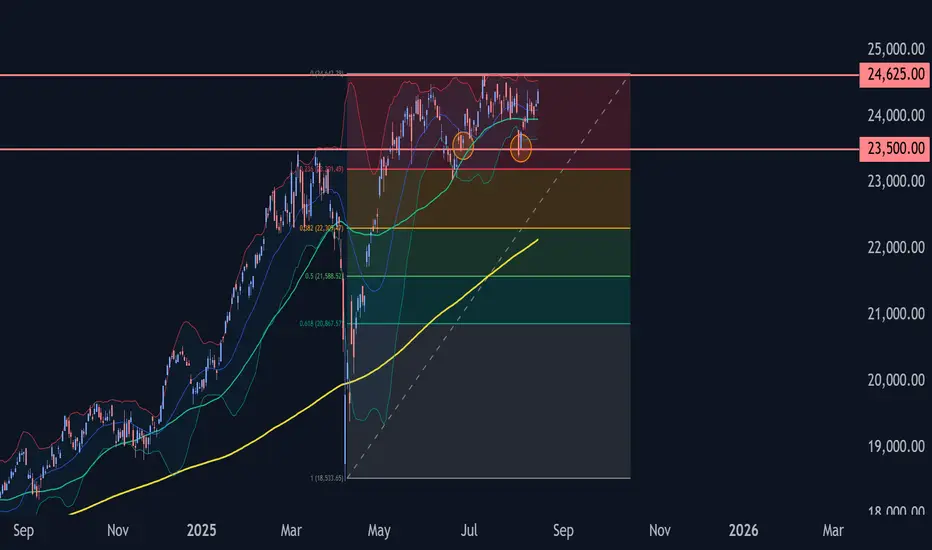
DAX Wave Analysis – 14 August 2025
- DAX reversed from the support level of 23500.00
- Likely to reach resistance level 24625.00
DAX index recently reversed up from the support level of 23500.00 (which has been reversing the price from May), standing near the lower daily Bollinger Band.
The upward reversal from the support level of 23500.00 started the active short-term impulse wave B.
Given the clear daily uptrend, the DAX index can be expected to rise to the next resistance level 24625.00, which stopped the previous impulse wave (3).
Trendline breakThe price broke a larger trendline followed by a pullback and smaller trendline to mark the end of the pullback and now the price is making a bullish impulse
WE ONLY TRADE PULLBACKS
