TSLA: SHORTNASDAQ:TSLA
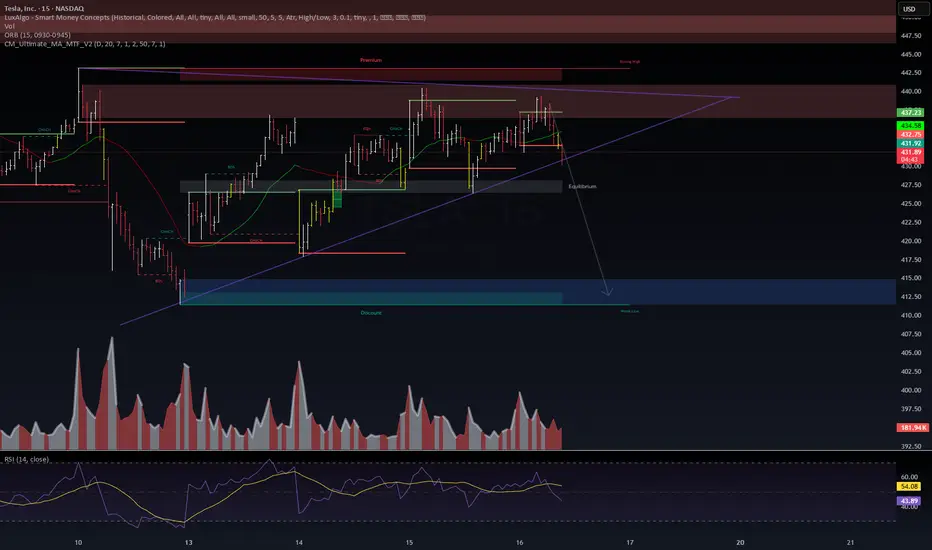
Setup aligning with VolanX DSS bias → short confirmation zone active.
Rising wedge pattern breaking structure
CHoCH under equilibrium, signaling early distribution
Volume increasing on sell-side
RSI divergence + loss of bullish momentum
Targeting $415–$412 liquidity zone (discount area).
Invalidation above $437.50 — clean risk box.
Bias: Short
Strategy: Wait for 15m BOS + volume spike confirmation 🧠
#VolanX #LiquidityZones #AITrading #SmartMoneyConcepts #TSLA
Trade ideas
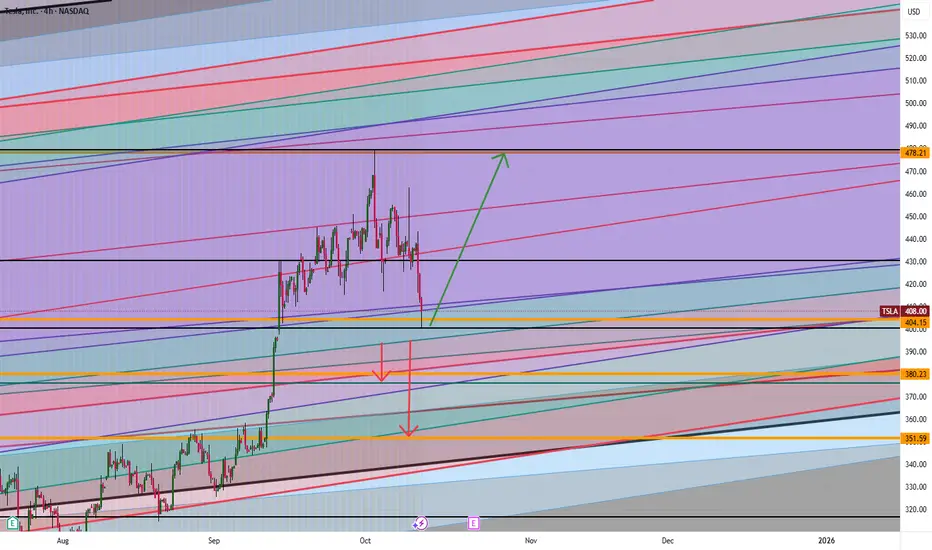
Tesla: Will It Blast Off or Fall Fast? The $404 Level Is the KeyTesla is at a big “make or break” point. If the price stays higher than $404, it could blast up to $437 or maybe even $478. But if Tesla drops below $404, watch out! It could fall down to $380 or even as low as $351.
Think about it:
What would you do if Tesla started moving toward those numbers? Do you think it will go up or will it go down?
If you’re not sure or have a question, send me a message! Sometimes asking one good question can help you make a smarter trade. What do you want to know about Tesla right now?
Mindbloome Exchange
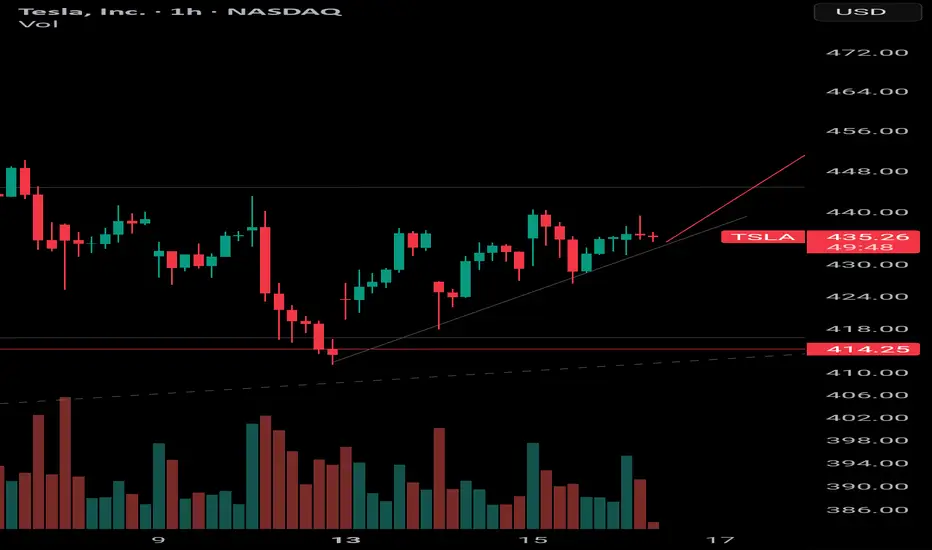
TSLA last point of support before push UPWhere the sellers at? Support is holding well close to a local resistance. Unless buyers are exhausted and wait for a pull back, we're going up from here into selling zone
Tesla (TSLA) — Momentum Reload or Major Cooldown?The Next $400–$450 Decision Zone!
🧭 Weekly Chart — Big Picture Momentum
Tesla has printed one of the cleanest BOS (Break of Structure) patterns on the weekly timeframe since the post-2023 recovery, confirming that the macro downtrend has flipped into a sustained bullish expansion. The stock ripped from its $216 CHoCH base and is now consolidating above the prior macro breakout line near $425.
However, the latest weekly candle shows stalling momentum, forming a short-term distribution near the $430–$440 region. That zone lines up perfectly with the previous supply structure and fib confluence from 2022 highs.
The MACD histogram remains strongly positive but is beginning to flatten — early warning that buying pressure might be easing. Stoch RSI is also hovering near overbought at 85+, signaling the need for a short-term reset before the next leg.
* Bullish scenario: A weekly close above $436–$440 would confirm strength continuation toward $488–$500, the next liquidity zone.
* Bearish scenario: A close below $410 opens the door for a healthy pullback to $367–$376, a major equilibrium level with demand imbalance and previous BOS base.
Weekly takeaway: Trend remains bullish, but short-term overextension hints at a pause or mild retracement before another drive up.
⚙️ Daily Chart — Structure and Cooling Phase
The daily chart confirms Tesla’s minor pullback within the larger bullish wave. After breaking above $400 with strong momentum, price is now consolidating just above its breakout order block ($415–$420).
The BOS on daily shows continuation potential, but MACD has started printing red bars — suggesting that momentum is fading and a retest is underway. The Stoch RSI sitting high around 93 indicates the correction may continue until momentum rebalances.
* Bullish case: If TSLA can hold $416 and print a higher low, the next upside targets are $442 → $455, then $488 (supply zone).
* Bearish case: A daily close below $414 would invalidate near-term bullish control, triggering a slide toward $400–$397, a major demand block that aligns with GEX PUT support.
Daily summary: Still in bullish structure, but short-term retracement needed for healthy continuation. Watch for $415 hold as pivot.
⏱ 1-Hour Chart — Trading Plan
On the 1-hour chart, TSLA is forming a short-term consolidation wedge between $420 and $436 after multiple CHoCH and BOS flips. The stock is bouncing between mid-range liquidity pockets, showing clear indecision from both sides.
MACD is recovering from a previous bearish cycle, while Stoch RSI has crossed up from mid-levels — showing early signs of a micro-bounce in progress.
Volume confirms that buyers are active at $424–$425 zone, but strong resistance remains near $436–$440.
Trading Plan:
* Bullish setup: Enter above $436 breakout with target $445 → $455, stop at $425.
* Bearish setup: Short if $420 fails with downside target $405 → $400, stop at $430.
This structure allows swing-to-scalp flexibility — traders can lean bullish above $425 but must stay cautious until price reclaims $436 decisively.
💥 Options GEX & Institutional Positioning
Based on the Options GEX chart:
* Highest Call Wall: $450 — heavy resistance and likely magnet if bulls push higher.
* Next positive GEX zone: $445, where gamma flips positive and market makers chase delta hedges upward.
* Major PUT Wall: $400 — strong defense area, aligning perfectly with chart structure and demand.
* IVR 25.7 / IVx 67.7 → volatility premium moderate, favoring directional plays with limited spreads.
Gamma interpretation: As long as price holds between $425–$440, market makers maintain positive gamma, keeping price pinned and range-bound. A clean breakout above $440 could trigger a gamma squeeze toward $455–$460.
🎯 Option Strategy Ideas
1️⃣ Bullish Continuation Play:
* Buy $430C / Sell $450C (Oct 25 expiry) — risk ~$6 for a potential $14 reward if Tesla rallies to $450+.
* Aggressive intraday: Buy 0DTE/2DTE $430 Calls only if price reclaims $436 with volume.
2️⃣ Bearish Hedge:
* Buy $420P / Sell $400P (Oct 18 expiry) — ideal if $420 support fails and correction deepens.
3️⃣ Neutral Income Strategy:
* Expecting chop between $420–$440? Sell Iron Condor ($440C/$450C and $410P/$400P) to profit from time decay.
💬 Final Thoughts
Tesla remains one of the strongest setups in the market — the bullish macro trend is intact, but current levels are stretched. Expect sideways or minor correction before another breakout attempt. The $415–$425 area is the key battleground: lose it, and we test $400; reclaim $436+, and the rocket’s back on for $455–$480.
My TA continues to show high win-rate accuracy, and if you’ve followed previous analyses, you’ve seen how precise these levels play out.
If there’s any stock you want me to analyze next — even ones I don’t usually post — DM me and I’ll be happy to break it down for you.
This analysis is for educational purposes only and does not constitute financial advice. Always do your own research and manage your risk before trading.

TSLA Long due to Exhaustion of sellersSellers are exhausted close to the local Resistance. We're expecting a rally at least as large as the last Rally or a 30% improvement

Tesla reports Wednesday; analysts expect EPS of $0.55Tesla reports third-quarter earnings Wednesday after the close, with analysts expecting EPS of $0.55, down from $0.72 a year earlier, on revenue of $26.2B — up 4%. There’s room for an upside surprise after record Q3 deliveries of 497,099 vehicles, boosted by the now-expired $7,500 U.S. EV tax credit, which also trimmed inventories. Analysts will focus on Elon Musk’s plans for robotaxi scaling, autonomy progress, and upcoming models through 2026, along with updates on new “Standard” Model 3 and Y trims. Wall Street projects about 450,000 deliveries in Q4.
Tesla is holding firm near $418, with its RSI turning higher to signal improving momentum. A positive EMA crossover — along with clear angle and separation between the averages — would confirm a strengthening bullish trend.

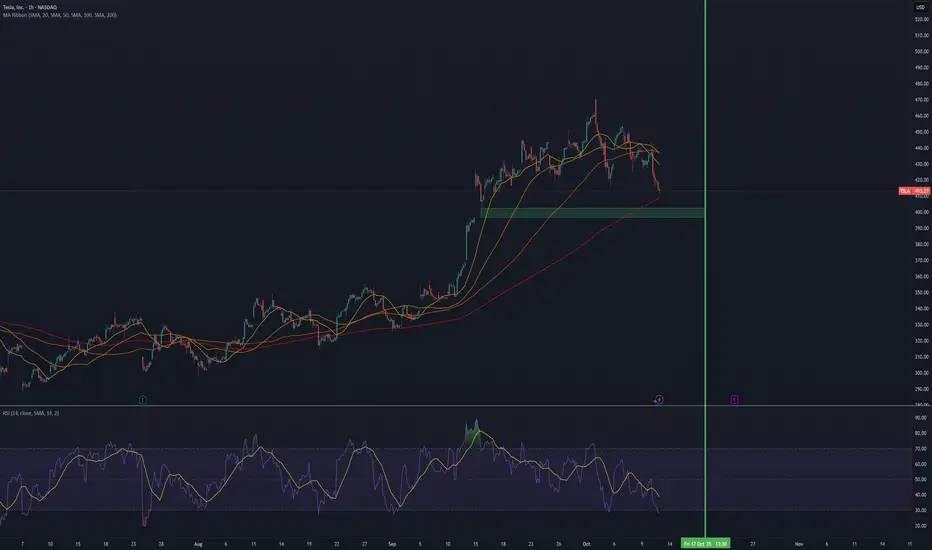
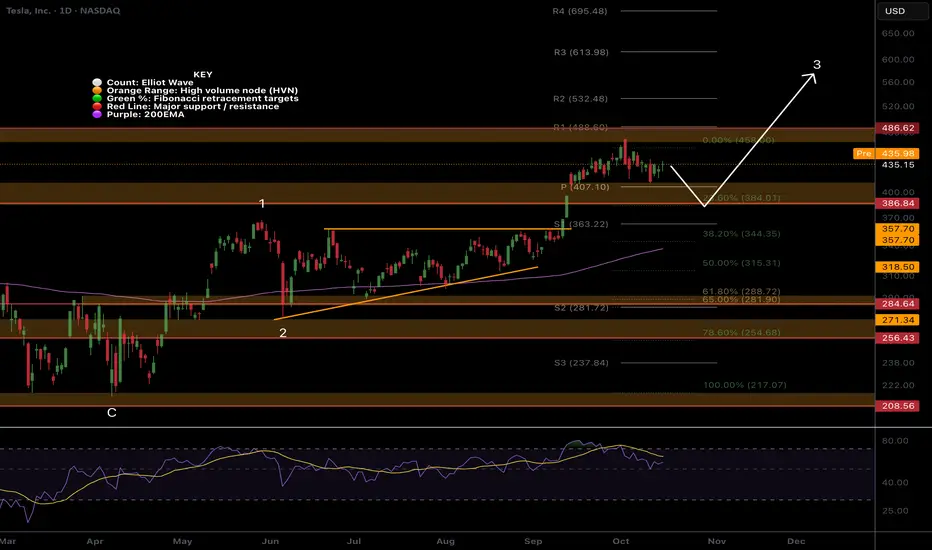
TSLA looks ready for higher in wave 3NASDAQ:TSLA found resistance at the all time High Volume Node and is trapped between that and the high volume support node.
The trend is up and strong. above the daily pivot and daily 200EMA with width.
I expect price to find support and continue into price discovery.
Safe trading
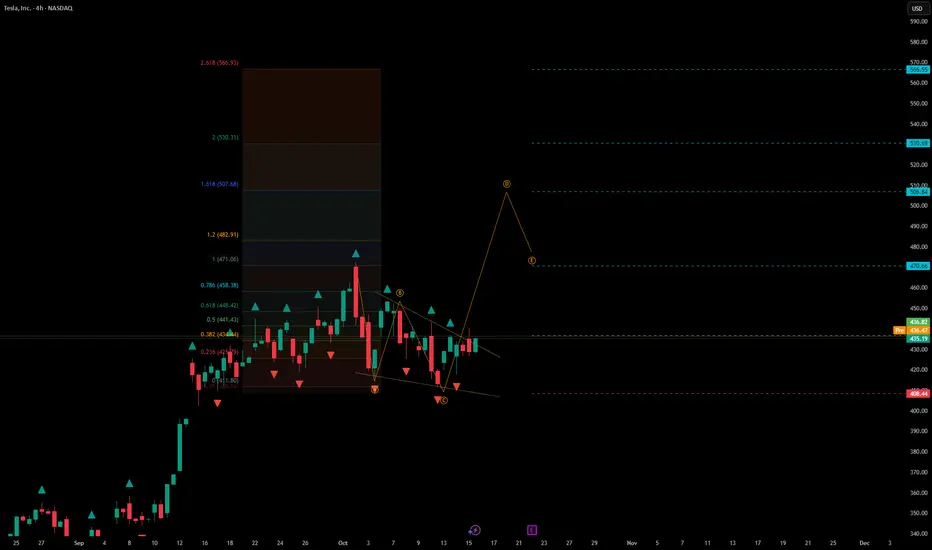
Tesla – ABC Formation as Trend Continuation#Tesla – ABC Formation as Trend Continuation
Current price: $435.8
Tesla is developing an ABC corrective structure that may act as a continuation pattern within the broader uptrend. Price action is consolidating after a strong impulsive leg, preparing for the next directional move.
🧩 Technical Overview
• The correction from the recent high appears to have formed a descending wedge, with the last swing down completing near the C-wave low.
• Price is now recovering from that area, suggesting a possible upward continuation phase.
• As long as the current low holds, the market structure supports bullish continuation through the upper Fibonacci levels.
📈 Scenario
• Structure: ABC correction completed; price attempting breakout to resume the dominant uptrend.
• Stop-loss: below the C-wave low (~$408).
• First upside objectives:
– $448–$458 — short-term resistance zone
– $470–$483 — key breakout area and prior swing high
– $507–$530 — potential extension zone if momentum builds
• A breakout above $470 would confirm trend continuation.
⚙️ Market Context
• The larger bullish trend remains intact after strong momentum from early September.
• Consolidation within the current wedge has reduced volatility — a typical setup before expansion.
• The pattern favors continuation as long as price holds above $408–$410 support.
🧭 Summary
Tesla is completing an ABC correction that could transition into the next bullish leg.
Holding above $408 keeps the structure valid for continuation toward $470–$530.
Breakout confirmation above $470 would reinforce the bullish scenario, while a drop below $408 would invalidate it.
Option Alert: $TSLA NOV 07 2025 $440 Calls – 78% ROI Potential WEnter: NASDAQ:TSLA NOV 07 2025 $440 CALLS
Buy in Price: $25.58 - $25.60
Take Profit: $45.53
Stop Bleeding: $22.51
ROI Potential: 78%
Exit Within: 2 Weeks

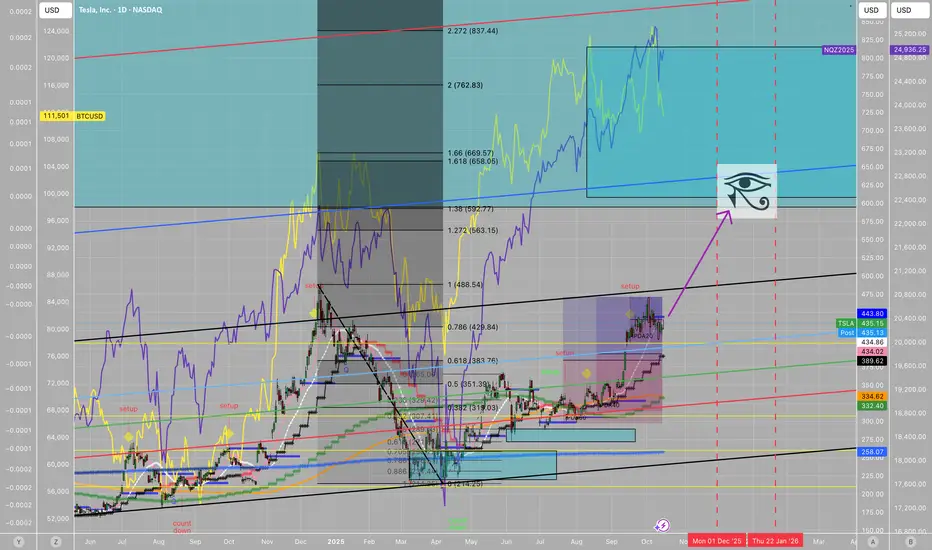
Timing of a $TSLA peaktiming of a NASDAQ:TSLA peak 12/1/2025 to 1/22/2026 based on astrology. target time zone between dotted vertical red lines.
price target is not specified but i expect some type of upper trendline hit along the fib channels.
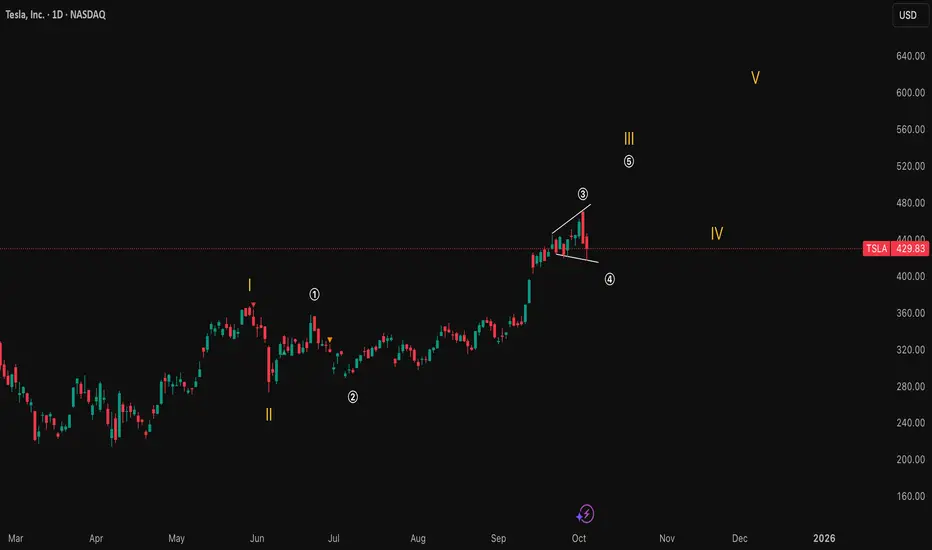
wave 4 in a wave 3 I’m predicting this path for Tesla — we’re in wave 4 of a larger wave 3, so it might get a bit volatile before continuing upward toward 500–520 . We’ll see what happens ☀️
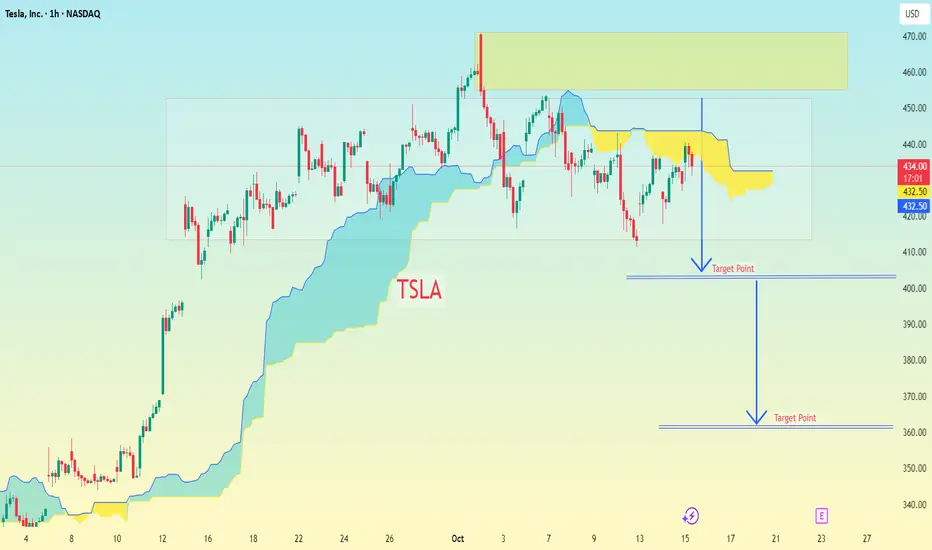
TSLA with Ichimoku Cloud...TSLA with Ichimoku Cloud and projected target points drawn below the current price.
Let’s break it down:
Current price on chart: around $434
Yellow zone (resistance): roughly $445–$465
First target line drawn: around $405–$410
Second (lower) target line drawn: around $365–$370
📊 Interpretation (based on my chart):
Target Level Approx. Price Meaning
1st Target $405–$410 Short-term support / take-profit zone
2nd Target $365–$370 Deeper correction / extended short target
⚠ Note:
These targets are based on my chart’s visual annotations, likely assuming price breaks below the Ichimoku cloud and moves toward lower support levels. This aligns with a bearish setup.
👉 Risk Management Tip:
If entering short, a stop loss just above the resistance zone ($450–$455) may be considered.
If entering long, these same levels can act as profit-taking or add-on zones.
$TSLA | Liquidity Grab or Reversal?⚡️ NASDAQ:TSLA | Liquidity Grab or Reversal?
Tesla’s 1H chart looks fragile.
Price rejected from the premium zone again.
Strong bounce today, but structure still favors the downside unless 450 is reclaimed.
Volume thinning near equilibrium — suggests a potential liquidity sweep before any major trend reversal.
RSI hovering near midline, no clear momentum shift yet.
📉 My bias: Short until November or unless we reclaim 450 cleanly. Watching 402–400 zone for reaction — that’s the next high-probability demand pocket.
🧠 Anything can happen — trade the reaction, not the prediction.
Not Financial Advice
#TSLA #Trading #VolanXDSS #AITrading #WaverVanir

Tesla's New Range. Hello I am the Cafe Trader.
Today we are revisiting Tesla (TSLA).
Last article we identified the Key seller before this big extension. Today I have identified the last key seller, and how you can capitalize.
Price has now entered into the Light Supply Zone , a place where sellers will try to slow things down.
It is likely that you will want to play TSLA at the Extremes. Strong Supply , and Strong Demand levels are going to give you the best chance at a stronger reaction. So if you are playing the short term, These two plays marked on the chart will be your best bet.
If the Strong Buyers hold at around 417, This will put a lot of pressure on that last strong seller at 461. A push through them should see you ATH's (not without a strong reaction from the Strong Supply first).
Missed out on the move and want to add TSLA to your long term?
Long Term
These Prices should match your conviction on TSLA:
Aggressive : 409 - 419.50 (Top of Demand, even better if you get into those strong buyers)
Value : 333-344
Extreme Value : 288-294 or the Conservative Trendline.
Expect big things from TSLA in the coming years. I would not be surprised to see TSLA reach over 1,000 again.
Happy Trading,
@thecafetrader

$TSLA 10/14/2025 Trade SetupOutlined the table, getting ready for the trade. Let's see what the market has to offer today.

a small dip before the moonI hope the market will retrace here and we will see the top of the market in 2026. Completing a whole market cycle.

TESLA My Opinion! BUY!
My dear friends,
Please, find my technical outlook for TESLA below:
The instrument tests an important psychological level 413.27
Bias - Bullish
Technical Indicators: Supper Trend gives a precise Bullish signal, while Pivot Point HL predicts price changes and potential reversals in the market.
Target - 428.09
Recommended Stop Loss - 405.57
About Used Indicators:
Super-trend indicator is more useful in trending markets where there are clear uptrends and downtrends in price.
Disclosure: I am part of Trade Nation's Influencer program and receive a monthly fee for using their TradingView charts in my analysis.
———————————
WISH YOU ALL LUCK

Tesla Correction ahead ? - Levels to be aware Of !In this video I present to you the idea of a Tesla correction into the 340/350USD price zone .
I mark out a potential short setup as well as a strong area for longs/accumulation.
Tools used TPO chart, Fibs, Anchored V wap , Volume Profile, Parallel channels
Good luck with your trading and thanks for your support

Take a bullish position on Tesla as price action shows strong up
Current Price: $413.49
Direction: LONG
Targets:
- T1 = $437.00
- T2 = $459.00
Stop Levels:
- S1 = $405.00
- S2 = $396.00
**Wisdom of Professional Traders:**
This analysis synthesizes insights from thousands of professional traders and market experts who closely monitor Tesla’s performance and future outlook. Collective wisdom heavily emphasizes Tesla’s innovative edge in the electric vehicle (EV) industry and its expanding lead into key growth sectors such as autonomous driving and energy storage. Traders see Tesla not only as a market leader but as a company with significant upside driven by its ability to announce game-changing technological advancements and strategic global expansions. The consensus suggests that Tesla’s ongoing operational improvements and rising demand have positioned it as a solid buy.
**Key Insights:**
Tesla’s robust fundamentals continue to drive optimism among professional traders. The company has successfully increased production capacity in 2025. Recent updates regarding its next-generation vehicle platform, dubbed "Project Titan", have reinforced confidence in long-term growth potential. The expanded Gigafactory projects in Mexico and Indonesia are helping to reduce unit costs, which traders believe will scale profitability and sustain earnings growth over several quarters. Analysts are also eyeing Tesla’s significant advancements in artificial intelligence applications, particularly its Full-Self Driving (FSD) suite, which might unlock tremendous recurring revenue streams like subscriptions.
Additionally, Tesla’s energy storage division is performing better than anticipated in 2025, directly contributing to revenue diversification. Traders argue that Tesla’s valuation is underpinned by its ability to integrate vertically across EV manufacturing, charging networks, and energy grids, making it more resilient to potential sector-wide downturns than its peers such as Rivian or Ford. Finally, technical indicators suggest bullish momentum reinforced by positive institutional inflows.
**Recent Performance:**
Over the last month, Tesla’s stock price has seen a notable rally. The stock has climbed approximately 10% since early September 2025, fueled by improving investor confidence from both retail and institutional participants. On the earnings front, Tesla’s Q3 2025 report released last week showed a 32% year-over-year increase in operating margins, surpassing consensus estimates. Key growth figures included over 20% jump in total vehicle deliveries and strong revenues from energy products. Such impressive performance confirms Tesla’s ability to scale production efficiently even while grappling with broader macroeconomic challenges.
**Expert Analysis:**
From a technical analysis perspective, Tesla appears poised for further upside. The Relative Strength Index (RSI) currently sits at 62, just on the cusp of being overbought, which suggests sustained bullish sentiment without yet showing overextension. The Moving Average Convergence Divergence (MACD) signals strong upward momentum, while Tesla is trading comfortably above its 50-day moving average of $398.25 and 200-day moving average of $376.00. Market observers are targeting a breakout above $420 as a critical resistance point, after which the stock could potentially push towards the $450 level.
Experts are also discussing Tesla’s valuation, which trades at a forward P/E multiple of 41—a premium to other automakers but justified by its superior growth trajectory. Analysts believe this premium valuation reflects Tesla’s several-layered optionality, including its disruptive position in both industry-leading technology and renewable energy solutions.
**News Impact:**
Recent headlines further bolster positive sentiment around Tesla. In early October 2025, Tesla announced final upgrades to its battery technology, revealing a solid-state prototype that could significantly extend range and durability compared to lithium-ion alternatives. Moreover, CEO Elon Musk’s comments during the last conference call pointed toward laser-focused execution on its next-gen product lineup and growth in emerging markets like Latin America. Further, discussions around government subsidies for EV adoption in Europe and tax incentives in the U.S. continue to create a more favorable electoral outlook for Tesla as it remains a pivotal player in the global EV race.
**Trading Recommendation:**
Based on Tesla's strong fundamental performance, bullish technical indicators, and its ability to expand capably in multiple verticals, taking a LONG position is recommended. The stock’s momentum suggests potential growth over the coming weeks, especially with Q3 earnings validation and positive news flow supporting investor sentiment. Traders should look for a breakout above $420 with a short-term upside target of $437 followed by $459 in the next leg of its rally. Implementing stops at $405 and $396 ensures risk management against market volatility, while remaining positioned for sizable gains.
Do you want to save hours every week? register for the free weekly update in your language!

TSLA Breakdown or Bear Trap? Oct. 13TSLA Breakdown or Bear Trap? Watch This Zone Before the Next Big Move
Tesla just had one of its hardest sessions in weeks — dropping over 5% on Friday and closing near $408, right on the edge of a major technical breakdown.
But here’s the thing: while the chart looks heavy, there are signs that sellers might be losing steam. Let’s unpack what’s happening from both the 15-minute price action and the 1-hour options (GEX) landscape so you know what to expect when the market opens Monday.
15-Minute Intraday Technical View
Friday’s price action was pure capitulation. After losing $430, Tesla slid straight down the channel and found temporary footing near $405–$408.
The 15-minute chart shows a clean descending structure with a trendline connecting lower highs — every bounce so far has been rejected.
But now, for the first time in two days, the MACD histogram is turning light blue, and Stoch RSI is curling up from deep oversold territory near 20. That means momentum is trying to flip, even if price hasn’t confirmed it yet.
The immediate level to watch at Monday’s open is $410–$415. If Tesla reclaims that area with strength, it could start an intraday reversal move toward $420–$425, where the breakdown started.
However, if it rejects there and breaks below $405, the next support isn’t until $395–$390, and that’s where the next flush could hit fast — especially if VIX spikes above 22 again.
The key is to watch volume and confirmation. A weak bounce without strong participation likely fails, but a reclaim above $415 with rising volume could catch shorts off guard and trigger a fast squeeze.
1-Hour GEX Analysis — Options Sentiment
The 1-hour GEX chart paints the bigger picture: this entire drop was dealer-driven.
The HVL (Highest Volatility Line) sits near $417–$420, which means that’s the line separating calm from chaos. Staying below it keeps TSLA in negative gamma territory — where every move feeds volatility instead of containing it.
Below the current price, there’s a massive Put Wall sitting around $395–$390, marking the highest negative GEX zone. That’s the “danger zone” where market makers start shorting more to hedge, which can accelerate a drop.
Above that, there’s heavy Call Resistance stacked around $445–$450, so even if Tesla bounces, it’ll hit resistance hard once it gets near $440+.
IVR sits around 29.4 with IVX at 70, showing that implied volatility is still very high. That means options are expensive — traders are paying up for protection, not confidence.
Right now, GEX positioning suggests Tesla’s price is trapped between $405 and $425, waiting for direction. If price holds and climbs above $420, gamma flips neutral and a short-term rally could unfold fast.
My Thoughts and Trade Ideas
Tesla is stuck in a volatility choke zone — but it’s not dead.
The 15-minute chart shows potential momentum reversal, while the 1-hour GEX confirms that option flows are balanced on a knife’s edge. Bulls need to push above $420 to break the cycle of dealer hedging and start a relief wave toward $430–$440.
If you’re scalping, watch for:
* Long setup above $415–$418 with volume confirmation — target $425–$430.
* Short setup if it fails $410 or breaks $405 — target $395, then $390.
For option traders, the 420C or 425C strike could work for a short-dated bounce play if volatility cools. But if fear continues, the 400P or 390P offers a safer directional hedge.
The real pivot for Tesla isn’t price — it’s sentiment. Once VIX calms below 20 and liquidity returns, Tesla usually leads the rebound. Until then, this remains a day trader’s battlefield.
Final Take
Tesla is coiled inside a descending channel but showing early divergence. Monday will determine if this is just another leg down or the first real reversal from oversold territory.
Above $420 = short-covering bounce.
Below $405 = more pain ahead.
Volatility will decide who wins.
Disclaimer: This analysis is for educational purposes only and not financial advice. Always trade your own plan and manage your risk carefully.

$TSLA in the buy zoneNASDAQ:TSLA retraced to 38.2% fib in a Wave 4 retracement. Wave 5 of 3 should take out the prior local high. I lightened my position earlier and now am ready to add to my position.

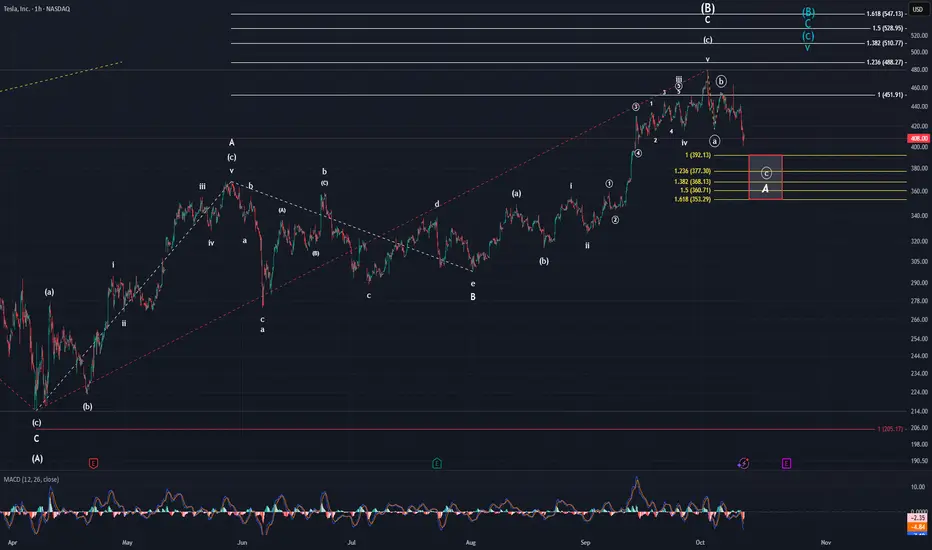
TeslaFriday was a rough day for anyone that was long...pretty much anything lol. There were a few tickers like MP that posted a green day, but they were far and few between. Tesla was no exception to this and closed down over $22. This should not have come as a surprise for anyone though. Maybe the magnitude in which the market turned downwards, but not that it did. I have been saying for 2-3 weeks that the top was near. that being said, although price tanked the way that it did, we technically do not have the confirmation needed for a top. Do I think it likely we have a top in place? Yes, I do. However, one cannot definitively say it is in for a fact. The absolute confirmation doesn't come until we can breach $368.33 unfortunately.
We will get clues and data pointing to a top on the way down though. The first thing I want to point out is that we have officially breached the last TWO wave 4's of a lesser degree. This in itself is a very good sign the top is in. Also, MACD made a new local low. When you look at the yellow fibs tracking the possible abc down, the 1.382 is just below that minor A wave top. This means over half of the standard target area for minute ((c)) of minor A is below the minor A high.
Another thing I want to point out is that in the overnights, Robinhood is showing Tesla trading @ $423 currently, and has raised as high as $425. This could be pointing to a couple things. The first is that the minute ((c)) wave is just subdividing into a smaller 3-wave pattern that will ultimately end within the target box to conclude minor A wave. The other is that Friday's low was the minute ((a)) wave low with ((b)) currently underway. Then lastly, it could be pointing to my ALT turquoise count that suggests another high to the low $500's is needed.
I do not like the turquoise count, but I cannot rule it out with 100% certainty yet, so it stays for now. The count that I favor is the white count, and ((c)) being carved out in three waves. Hopefully we get some clarifying data tomorrow, but if not, we should get some this week. For now, we continue observing. Should you not be able to help yourself and want to enter into a trade...use TIGHT stops. I am not a gambling man, so I will remain on the sidelines. Ultimately, I believe it is only a matter of time until we see price back into the $100's...
TSLA Week Ahead - ShortTSLA looks like a classic post-rally consolidation after that sharp pop from late September lows around $340. The candlesticks show solid volume on the upside thrusts (those red-to-green hammers mid-September), but we're seeing some profit-taking wicks lately, with the price hugging that rising EMA channel (orange line) around $410 support. That unfilled gap down at $396-$402 (from early October open?) is screaming "magnet" if we get any broader market weakness—gaps like that on high-beta names like TSLA often fill on light-volume Fridays, especially with no major catalysts this week.
The gap is likely to close 70% of the times in 30 day span.
What to Expect by EOD Friday (Oct 17)
No earnings till Oct 22, so this week's all about macro vibes (Fed chatter, CPI print Wed) and TSLA-specific noise like Robotaxi buzz or delivery whispers. Q3 deliveries hit 462k on Oct 2 (beat estimates), so that's baked in—focus shifts to affordable model teases.
Base Case (60% odds): Sideways grind to $415-425. We're in that expected move band of ±6% (~$388-438 from here). Light volume mid-week could keep us coiling in the channel; that gap stays open unless we dump on risk-off. Analysts are meh short-term (avg target $361, but that's 1Y noise), but one shop just hiked to $483. I'd fade any spike above $420 for a quick scalp—RSI's overbought on 1H.
Bull Case (25% odds): Push to $430+. X crowd's frothing—folks calling ATH break by 10/17 on "unstoppable momentum" and 5Y consolidation snap to $500. If CPI undershoots and Elon tweets FSD gold, we tag resistance. One forecast pegs exactly $425 EOW.
Bear Case (15% odds): Gap fill to $400. Volatility spikes if yields rip higher or China EV FUD hits (ZEV credit chatter ending soon). That purple MACD histogram's flattening—watch for divergence.