TSLA Tesla DowntrendIf you haven`t bought the dip on TSLA:
nor sold the regional top:
Then it's worth noting that it seems to be entering a downtrend due to intense competition from Chinese EV rivals like Li Auto, Nio, XPeng, and notably, BYD.
TL0 trade ideas

Tesla TSLA not currently out of the woods but bottom may solidy Tesla, poor boy, seems to be trying to pour some concrete for a bottom. Sorry, can't say go long until the price goes above the sagging trendline and bounces. On the other hand, it's just too low to take a negative position to go further down. Beatup but TSLA is never out. No trade until the upside breaks the trendline and bounces in confirmation.

Understanding the Differences Between Stock Market and Crypto P2Thank you very much for your support, as I told when we will get 20+ likes on Part 1, than I will make Part 2. Here you get the summary of each, with the other points:
10. Market Infrastructure: The infrastructure supporting traditional stock markets, including trading platforms, clearing systems, and market data providers, is well-established and interconnected, whereas the infrastructure for the crypto market is still evolving and fragmented, with multiple competing platforms and protocols.
11. Market History: Traditional stock markets have a long history dating back centuries, with well-documented market cycles and economic trends, whereas the crypto market has a relatively short history, with significant price movements driven by technological developments and market speculation.
12. Regulation of Investment Products: Traditional stock markets offer a wide range of investment products, including stocks, bonds, mutual funds, and exchange-traded funds (ETFs), all subject to regulatory oversight, whereas the crypto market primarily offers cryptocurrencies and tokenized assets with varying degrees of regulatory clarity.
13. Market Correlation: Stocks and traditional financial assets often exhibit correlations with broader economic indicators such as GDP growth and interest rates, whereas the crypto market may demonstrate correlations with factors such as Bitcoin dominance, market sentiment, and technological developments.
14. Market Participants: Traditional stock markets attract a diverse range of participants, including retail investors, institutional investors, hedge funds, and pension funds, whereas the crypto market has a more diverse participant base, including retail traders, technology enthusiasts, speculators, and early adopters of blockchain technology.
15. Market Fragmentation: The stock market operates as a unified marketplace with standardized trading rules and regulations, whereas the crypto market is fragmented across multiple exchanges, each with its own trading protocols, liquidity pools, and pricing mechanisms.
16. Market Impact of News Events: News events such as corporate earnings releases, economic data reports, and geopolitical developments have a significant impact on stock market movements, whereas the crypto market may react more strongly to news related to regulatory developments, technological advancements, and adoption trends.
17. Market Efficiency: The efficiency of traditional stock markets is supported by established trading mechanisms, liquidity providers, and market makers, leading to relatively stable price discovery and reduced arbitrage opportunities, whereas the crypto market may experience inefficiencies due to lower liquidity, market manipulation, and regulatory uncertainties.
Stock Market:
Pros:
Stability: Stock markets have a long history and are generally stable investment options.
Regulation: They are heavily regulated, providing a level of security for investors.
Diversification: Investors can choose from a wide range of stocks across various sectors and industries.
Dividends: Many stocks offer dividends, providing a source of passive income.
Access to Information: There is a wealth of financial information available for analysis and research.
Cons:
Limited Trading Hours: Stock markets operate during specific hours on weekdays, limiting trading opportunities.
High Entry Barriers: Some stocks may require a significant investment, making it inaccessible for small investors.
Market Volatility: While generally stable, stock markets can still experience significant volatility during economic downturns or market crises.
Slow Settlement: Settlement times for stock transactions can take several days, delaying access to funds.
Limited Accessibility: Access to certain stocks may be restricted based on geographical location or regulatory requirements.
Crypto Market:
Pros:
24/7 Trading: Cryptocurrency markets operate 24/7, allowing for round-the-clock trading.
Accessibility: Anyone with internet access can participate in the crypto market, promoting inclusivity.
Potential for High Returns: The crypto market has seen explosive growth, offering the potential for high returns on investment.
Decentralization: Cryptocurrencies operate on decentralized networks, reducing dependency on centralized authorities.
Technological Innovation: The crypto market is at the forefront of technological innovation, with developments in blockchain and decentralized finance (DeFi).
Cons:
Volatility: Cryptocurrencies are highly volatile and can experience rapid price fluctuations.
Lack of Regulation: Regulatory uncertainty in the crypto market can lead to investment risks and market manipulation.
Security Risks: Cryptocurrency exchanges and wallets are susceptible to hacking and cyberattacks.
Limited Adoption: Despite growth, cryptocurrencies still face challenges in widespread adoption as a mainstream form of payment.
Complexity: Understanding cryptocurrencies and blockchain technology can be challenging for newcomers, leading to potential investment mistakes.
Summary:
Both the stock market and the crypto market offer unique opportunities and challenges for investors. The stock market provides stability, regulation, and a wide range of investment options, while the crypto market offers accessibility, potential for high returns, and technological innovation. Deciding which market is better depends on individual preferences, risk tolerance, and investment goals. Diversification across both markets may provide a balanced approach to building an investment portfolio.

TESLAI think that Tesla has completed the correction process, I think that it is likely to be the end of a 4th wave, and I believe that there will be sharper increases with the breaking of the narrowing triangle.

Investment Opportunity TESLAWe are back on an interesting demand zone which initiated a big upside push, it means there is a lot of buy orders, if the price react well on this demand zone and break 184 price with a least a daily candle, I will buy TESLA.
Target Price Upside : 71% and more
Stop Loss : 16%

TESLA weekly chart - on the cross roadsSUMMARY - Neutral with NASDAQ:TSLA being right at support of ~$160
current weekly chart for TESLA:
- June 2022 and Nov 2022 had very similar MACD charts showing 2 very different scenarios (outcomes)
- In scenario 2, however, the VORTEX was totally different, very deep in the red
- currently, the VORTEX (indicator at the bottom) looks more like scenario 1 from June 2022
- the downward channel (adjusted) has been less steep now but can't be disregarded yet.

Tesla BounceTesla has found a floor, I would expect a bounce to 200 level. Be careful if price doesn't get up immediately

TESLA BEAN CANTHIS IS GOING TO BEAN CAN RIGHT AROUND MAY 9. GOING TO BE A PARABOLIC BEAN CAN THAT MELTS FACES. it is going to be so crazy how big this trade is going tobe inshallah mashalla

TESLA WILL RISE (in second half of the year)Tesla had some bad news in the last months but it will come back. It is just a question of when

TSLA Analysis: Price Recovers after Disastrous ReportTSLA Analysis: Price Recovers after Disastrous Report
We previously wrote that lower vehicle deliveries could lower TSLA's stock price.
And as it became known on Tuesday, Tesla, led by Elon Musk, delivered just 386,810 cars in the first three months of 2024 - 14% below analysts' forecasts, according to Bloomberg. As a result, Tesla shares fell 4.9% that day, extending their 2024 decline to 33%, the worst performance in the Nasdaq 100 Index.
What is the market outlook?
Bullish arguments:
→ After a strong disappointment on Tuesday, the price of TSLA showed signs of stability on Wednesday and Thursday. Since these were bullish candles, and the market was recovering despite the non-bearish gap on Tuesday, this can be interpreted as a sign of demand.
→ From the point of view of technical analysis, the market is supported by the lower border of the downward channel (shown in red). The price forms rebounds from this border, as shown by the arrows.
→ Bloomberg writes about a decrease in the number of short positions after the report on Tuesday. This could be a sign that short position holders do not see any further decline in the price of TSLA and are taking profits.
Bearish arguments:
→ TSLA price is still in the lower half of the downward channel, despite the bullish sentiment in the stock market.
→ Resistance may come from the level of USD 183 per share and the median line of the descending channel.
If the bears continue to dominate, the price of TSLA could fall towards the psychological level of USD 150 per share. But the balance of sentiment may be changed by the release of Tesla’s first-quarter reports, scheduled for April 17.
This article represents the opinion of the Companies operating under the FXOpen brand only. It is not to be construed as an offer, solicitation, or recommendation with respect to products and services provided by the Companies operating under the FXOpen brand, nor is it to be considered financial advice.

Navigating the Bearish Currents - A Technical Perspective.Tesla, Inc. (TSLA): Technical Analysis Report
In the context of Tesla's current weekly price action, a convergence of bearish indicators warrants a cautious stance. The stock, last recorded at $171.11, hovers at the precipice of the lower Bollinger Band, traditionally a demarcation of oversold conditions, yet the band's expansion underscores prevailing volatility rather than a definitive bullish reversal signal.
A scrutiny of moving averages reveals that the price trajectory has decisively punctured the 20-week SMA, currently positioned at $267.99, which has historically served as a dynamic fulcrum between bullish and bearish phases. This recent downturn beneath the SMA augments the bearish thesis.
The Fibonacci retracement levels, extrapolated from the nadir of March 2020 to the zenith in November 2021, denote a breach of the pivotal 61.8% level. Market orthodoxy suggests this breach could potentially precipitate a further decline towards the 78.6% Fibonacci level, a juncture that has yet to be tested.
An examination of volume patterns accentuates the bearish narrative, with a conspicuous predominance of selling pressure evident in the recent spate of weeks. This is exemplified by a succession of red volume bars, each eclipsing their green counterparts, denoting the intensity of the distribution phase.
Complementing the price-volume action, the Relative Strength Index (RSI) teeters on the edge of the oversold threshold at 37.86. While not yet signaling a capitulation, its proximity to the oversold territory may portend a potential inflection point should a further descent materialize.
In juxtaposition to the technical indicators, Tesla's financial health, as intimated by its net income trajectory, reveals a disconcerting downtrend in quarterly performance. This fundamental aspect, in tandem with technical pressures, compounds the case for a guarded outlook.
In synthesis, Tesla's technical posture is marred by bearish undertones, with multiple indicators corroborating a scenario ripe for continued retracement. Vigilance is advised around the 78.6% Fibonacci level, which may offer a sanctuary for price stabilization. Traders and investors alike should remain attuned to volume fluctuations and RSI readings for early signs of a trend reversal or consolidation. Notwithstanding, the intersection of technical adversity and waning financial metrics prescribes a strategy of prudence and stringent risk management.

Tesla Stock Down 30% This Year. What Happened to the EV King?The electric-car maker is in dire need of charging after losing more than $260 billion this year and turning Elon Musk into the biggest loser among the world’s wealthiest.
Table of Contents
» How It Started vs How It’s Going
» Nothing Magnificent About It
» Competition Revs Up
» Teslas Pile Up on Weak Demand
» If You’re Having a Bad Day, Read This
📍 How It Started vs How It’s Going
Tesla (ticker: TSLA ) kicked off the year as the big tech highflyer we all know. With a valuation of more than $780 billion, the electric-car maker stepped into 2024 as the world’s largest EV seller. Deliveries were standing at record highs and chief executive Elon Musk was the world’s richest person and was looking at a gargantuan $55 billion pay day.
All of that was taken away in one way or another. Chinese automaker BYD (ticker: 1211 ) dethroned the EV kingpin by selling 526,000 EVs for the fourth quarter of 2023, more than Tesla’s 484,000. Even as Tesla reclaimed the top spot in the January through March quarter, it flagged a worrying signal that its business was shrinking.
As for Elon Musk, he lost a court battle over his lofty $55 billion pay package when a judge called it “an unfathomable sum.” Shortly before that, he handed the World’s Richest title to Amazon founder Jeff Bezos .
📍 Nothing Magnificent About It
Chugging through first-quarter twists and turns, Tesla drifted away from the highly exclusive club called the “Magnificent Seven.” The group of companies with a snappy nickname is made up of Microsoft (ticker: MSFT ), Nvidia (ticker: NVDA ), Facebook parent Meta (ticker: META ), Google parent Alphabet (ticker: GOOGL ), Amazon (ticker: AMZN ), Apple (ticker: AAPL ), and outsider-in-the-making Tesla (ticker: TSLA ).
How did that happen and why is Tesla at risk of falling out of the Magnificent Seven? Tesla’s valuation — which is notoriously volatile and hard to pinpoint — saw a massive 30% drop over the first three months of 2024, turning the stock into the worst performer in the S&P 500. More than $260 billion has been washed out since early January, giving the EV maker a price tag of around $520 billion today. Zoom further out, and you see Tesla peaked during the Reddit stocks meme-trading era of 2021 when shares hit an all-time high of $417. Back then, Tesla became the first car manufacturer to break into the $1 trillion club.
Tesla stock has lost about a third of its valuation this year. Source: TradingView
The drastic fall spotlights a stark difference between Tesla and the rest of the Magnificent Seven big shots. The other tech giants are at the top of well-developed yet competitive industries. Take for example Microsoft — the software mainstay has created for itself a competitive moat in the enterprise and retail software business.
Tesla, on the other hand, is the trailblazer for the EV revolution but charged up rivals are shifting gears, threatening to soak up market share fast.
📍 Competition Revs Up
Chinese smartphone maker Xiaomi (ticker: 1810 ) last week unveiled a slick-looking, tech-rich electric ride. The model is called SU7 and it clocked up 10,000 reservations in the first 4 minutes after launch. Then it got to 89,000 in 24 hours. The successful launch bumped Xiaomi’s market cap by $4 billion to around $50 billion, or 10 times less than Tesla. The SU7, however, is priced lower than a high-end Model 3.
Tesla has more rivals to outsell, among them BYD (ticker: 1211 ) and the more-niche player Rivian (ticker: RIVN ). Rivian is an EV startup that marked a 70% increase in sales for the first quarter. The number, however, is a tiny 13,980 units delivered.
📍 Teslas Pile Up on Weak Demand
Tesla’s year went from bad to worse this week when it announced it had delivered 386,810 EVs in the first quarter. The number was about 20,000 below the most bearish forecast on Wall Street. It was also 9% lower than last year’s first quarter, indicating that the company’s business is shrinking.
More importantly, Tesla produced 433,371 units, leaving about 46,000 waiting to be purchased by customers. The difference between production and deliveries meant that unsold models are piling up. A demand issue maybe?
📍 If You’re Having a Bad Day, Read This
In all that chaos, Elon Musk emerged as the world’s worst moneymaker, taking a huge blow to his net worth so far this year. According to the Bloomberg Billionaires Index , the eccentric engineer is down $45 billion to roughly $180 billion, taking the number one spot on the loser board.
Elon Musk owns a 20.5% stake in Tesla worth about $120 billion, according to a December 31 filing . The stake consists of 411 million shares of common stock and 303 million stock options with a strike price of $26 a pop.
The majority of Musk’s wealth is concentrated in his EV company, but he also owns private social media platform X, former Twitter, and space exploration company SpaceX, among other businesses.
📍 What’s Your Take?
Are you buying the dip in Tesla stock? Or are you waiting for a deeper drop before scooping up some shares for yourself? Let us know your thoughts on Tesla’s future in the comments below!
🚀if you liked this article, give us a follow to make sure you don't miss any.
💖 TradingView Team

Relative Strength between NVDA and TSLA about to shift.Head and Should Pattern on TSLA/NVDA chart.
This chart basically shows the relative strength between these two stocks, if we have a follow through tomorrow. TSLA will outrun NVDA in the short-term.
Meaning:
1. If we are going to have a bounce tomorrow, TSLA will most likely to outrun NVDA.
2. If Non-Farm and Unemployment rate kill the market tomorrow, TSLA will most likely to drop less than NVDA.
However, I think SOXL is currently sitting at the trendline support. I think bounce is imminent in the near term.

1.2 & 1.2 Bullish Market Pattern Analysis Weekly OutlookDear analysts and traders,
I hope you are doing well and are motivated for the week ahead. I wish you all the success in your business endeavors. Remember that success in trading lies in consistently defining and sticking to your rules.
As someone interested in the Elliott Wave Principle, I find it to be an invaluable tool for market analysis. I have developed my approach by combining this principle with my personal experience and by considering different scenarios that are likely to occur in the market. It should be noted that I do not like to be surprised in the market, and that's why I have different market prospects. I follow them to be sure and recognize the structure that is forming so that I can 100% recognize it.
I will share my analysis with you, but please note that I am not providing any buy or sell signals. My perspective on idea analysis is completely unbiased, so if the idea analysis meets your standards, you can use it as a guide to make an informed decision.
I have attached my previous analysis of the same market so that you can compare and see the differences. All the details of my analysis are clearly labeled, making it easy for you to understand. However, having a basic familiarity with the Elliott Wave Principle theory will help you understand the analytical idea more easily.
I have been studying the Elliott Wave Principle for almost three years now, and over time, my understanding of this knowledge and experience has grown. What I have achieved so far is the legacy of a genius called Ralph Nelson Eliot, and I am really happy with my progress. May peace be upon him.
Thank you for your support so far. I will always remember your kindness. Please share your comments and criticisms with me.
I hope my analysis will be useful to you in your business journey, and I wish you all the best.
Sincerely,
Mr. Nobody

TESLA - LONG TESLA is in downtrend since july 2023.
Currently the price has given the breakout from falling wedge with bullish div and now seems like the bulls are getting ready for some strong upside movement.
If the market continue to trend higher , the next optimum target could be 215-217
followed by 238-241.

The Trend is Our Friend...... but not this time. We are in sideward mode. And our friend should not help us.
But the overall market today was a jump down. And in this respect Tesla held not so bad. as it managed to recover from today's low and the one year old bottom has not been touched.
That's why I think that Tesla may have the potential of a minor correction upward now.
There is a support zone between the January/February 2024 trading range and the April 2023 bottom now.
If this will hold then the idea of a correction in our sideward market for Tesla is likely.

TESLA: CTRLC + CTRLVHi guys, if you are planning to learn how to trade or invest, let me know.
This is a little example of what I do for my clients.
Am I telling that now the price will skyrocket? No.
Am I telling I opened a mega long position in January 2023 and now I don't care about a retracement? Yes.
Want to finally learn how to do a good trade? Just one can change your portfolio.
Let's see how will move the market in coming months.
Unfortunately I can share here my position, but u can reach me on X, link in my Bio.
See you.

TSLA Long from $169 TSLA Long from 169
Adding targets for new Elliot wave structure and retracement of recent Bear movement.
overlay of previous chart patterns to mark potential path alignment.


TSLA Long to $200 mid AprilTSLA Long to $200 mid April
Long at $169 + Add calendar put spread (Sell 160P 4/26 Buy a 170P 4/12) +$1.00

Tesla's Alternate Scenario 📈🔍Regrettably, our Tesla trade within the 2-hour timeframe faced an unexpected stop-out. The anticipated completion of Wave 2 hasn't manifested, evident in the broader timeframe. Initially, we presumed it concluded at 50%, specifically at Wave C around $195.
This presumption was invalidated post the recent earnings call, signaling a potential double correction. Consequently, we envisage establishing the bottom for Wave 2 within the range of 61.8% and 78.6%. Should this support falter, the price may decline, reaching at least $100. A breach below this level introduces an entirely different narrative for Tesla. It is crucial for the level to hold; otherwise, the bullish scenario could be flawed and invalidated.
In the midst of selling pressure, opportunities often emerge, particularly during a Wave 2 correction. It is characteristic that circumstances may appear more challenging than when Tesla was valued at $100. Therefore, our expectation revolves around a reversal between $177 and $144, paving the way for a subsequent surge towards $500. 📈🔍

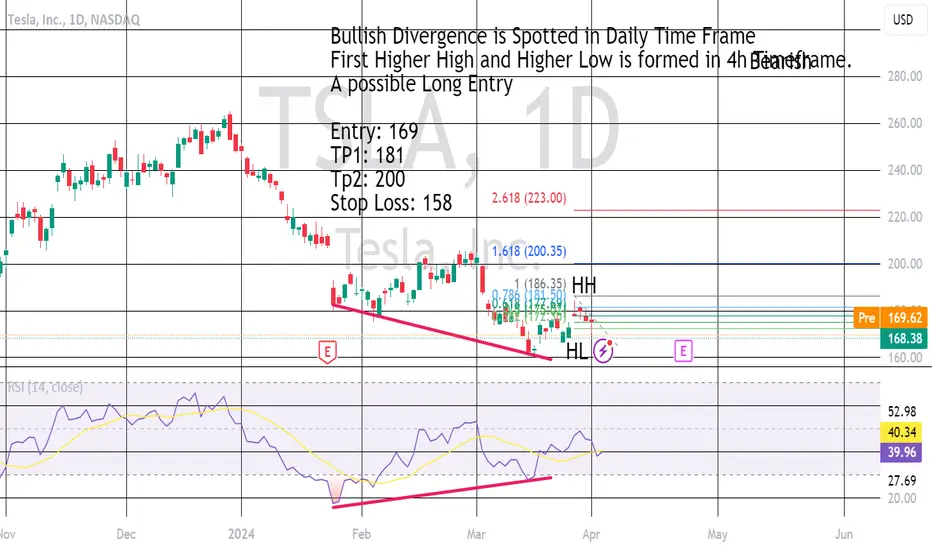
TESLA showed Bullish Divergence at Daily TimeframeTesla is showing a good recovery from its downward trend. A bullish Divergence at Daily TF and formation of HH and HLs at 4H TF indicating a possible long entry. This is not a Financial Advice. Please do your own research.
Tesla’s Technical Crossroads.“As we assess Tesla, Inc. (TSLA) through the lens of technical analysis, it is prudent to incorporate recent news and fundamental developments, yet our focus remains on the story told by the chart. The Ichimoku Cloud paints a picture of resistance overhead, with the price navigating below the cloud—a bearish signal. The conversion and base lines (not visible in the image but typically part of the Ichimoku setup) would provide additional context on short-term momentum.
Looking closely, a potential bullish signal is developing as the price is attempting to breach the cloud from below, which could suggest a change in trend if sustained. However, this bullish scenario must be taken with a pinch of skepticism, as the broader Ichimoku setup suggests bears are currently in control.
Transitioning to the RSI, we observe the momentum has been erratic, yet the recent uptick signals increasing buying pressure. It’s essential to monitor if the RSI can sustain above the mid-line (50 level), reinforcing the buyers’ resolve. Nevertheless, with the RSI hovering below 50 for a considerable period, the momentum has been predominantly bearish.
In light of the preceding analysis and considering Tesla’s news cycle, one might adopt a cautious stance. Should the price consolidate above the cloud, accompanied by a supportive RSI, one could argue for a bullish reversal. Conversely, failure to breach the cloud may reaffirm the bearish bias, and traders might seek opportunities to capitalize on potential pullbacks within the prevailing downtrend.
Investors and traders must be nimble, aligning their strategies with the evolving technical landscape and staying attuned to Tesla’s dynamic news flow, which can swiftly shift sentiment and, by extension, price action.
