Tesla's should find support at $152 and bounceTesla's should find support at $152. We expect some technical bounce at that bottom level of the channel
TL0 trade ideas

(NASDAQ:TESLA) STOCK UNDER $100.00?WATCH SUPPORT LEVELS TO PAY ATTENTIO!
Short Term Price Target
$155.27 to 146.54
1. Tesla's Stock Price Below $100.00: The fact that Tesla's stock could drop below $100.00 suggests a significant bearish sentiment in the market. Investors may be concerned about the company's performance or broader economic factors impacting the stock.
2. Possibility of Dropping Below Support #1 and Ascending Support Line: If Tesla's stock breaks below Support #1 and the ascending support line, it indicates increasing selling pressure and a potential shift in the trend. This could be a signal for traders to anticipate further downside movements.
3. Potential Decline to $118.68 - $91.10 Range, Potentially Breaching Support #2: Breaking below the ascending support line increases the likelihood of a decline to levels between $118.68 and $91.10. Breaching Support #2 could intensify the downward momentum, leading to further losses for Tesla's stock.
4. Gap Fill at $75.69: Should the price breach Support #2, there's a chance that Tesla's stock might fill the gap observed on January 25 and 26, 2023, at $75.69. Gap fills often act as significant support or resistance levels and could influence future price movements.
5. Potential for Return to Pre-COVID Levels: Whether Tesla's stock could return to pre-COVID levels depends on various factors such as the company's fundamentals, market sentiment, and broader economic conditions. While it's possible for stocks to recover from downturns, it would likely require positive catalysts and a favorable operating environment for Tesla to regain its pre-COVID price levels.
In summary, the outlook for Tesla's stock appears bearish in the near term, with potential further declines and a possibility of returning to levels observed during the COVID-19 pandemic. However, long-term prospects would depend on the company's ability to address underlying challenges and capitalize on growth opportunities.
NFA
PLEASE, DYOR/MYOD!!
Hope to See your Likes 👍 to Support My Work
To Follow All My Ideas, Go to My Profile and Select the Follow Green button 😁
Please Re-Evaluate Before Make Your Last Decisions
Check my Profile for more.

TSLA ready for dead cat bounceTSLA appears ready for a dead cat bounce. After breaking out from a symmetrical triangle, it fell hard but has since found some kind of support.
The RSI is oversold and showing small bullish divergences. The MACD also exhibits bullish divergences and is attempting to make a cross on the lines.
Yesterday, TSLA formed a bullish candlestick hammer.
Additionally, it is forming a falling wedge, a fairly bullish pattern. If the price truly found support and breaks through the upper falling trend line, it would confirm the hammer reversal pattern, validate the breakout of the falling wedge, and confirm bullish divergences on both the RSI and MACD.
However, all of these indicators could merely signify a dead cat bounce. The highest move in my assessment would be until the 200-day MA, also known as the BigRed area.

TESLA swing long positionhi traders.
Let's have a look at Tesla stock on Weekly time frame.
The price is sitting on the support now but we're expecting the break down.
If the support fails, we may see a swift capitulation towards the next support which is around 100 -110 $ . This level could be an entry for a long position. If the price drops there, it would create a double bottom pattern which is bullish and the reversal from there can be expected.
The target: 216 $
stop loss: 96 $
Good luck

✅TESLA NEXT MOVE|LONG🚀
✅TESLA is going down now
But a strong support level is ahead at 152.50$
Thus I am expecting a rebound
And a move up towards the target at 170.00$
LONG🚀
✅Like and subscribe to never miss a new idea!✅

Simple chart analysis for Tesla on H1The other one that I post was a weekly one.
Elliot Wave finished. ABC correction finished. Waiting for second abc.
Chart has recently finished E.W. but it can reach a little more toward 338%. Even so, I don't sugest to wait for it since it can go down any moment.
I use fibonacci between peak 1 and peak 4 of E.W. to know fifth wave limit.

TSLA Vertical Rainbow SurgeProbability of FSD now is pretty high, Tesla shows conviction by lowering FSD price so more and more people can try the software while opening the floodgates for more data to make the system robust enough for deployment. When looking at the amount of data estimated to be reliable enough for deployment ( 6Bn miles ) and the chart tesla published + the fact we no have a lot more people making mile, the robotaxi reveal at 8/8 will probably be around the same time this 6Bn miles will be reached.
Chart shows obvious up trend gained through my stock astrology energies.

TESLA lays off more than 10% staff. Is this its 'META moment'?It was reported this morning that Tesla (TSLA) "will lay off more than 10% of its global workforce, an internal memo seen by Reuters on Monday shows, as it grapples with falling sales and an intensifying price war for electric vehicles".
The market has so far reacted with strong selling of more than -3% in early trading. But is this really bad news?
Not so long ago (November 09 2022), another high tech giant that was heavily decimated at the time, Meta Platforms (META), announced lay offs of around 13% of the company (more than 11000 employees). This was just 5 days after the November 04 2022 market bottom. The result (chart on the right) was an aggressive recovery above the 1D MA50 (blue trend-line), which turned into a Support for 240 days straight.
Of course the fundamental difference is that the 2022 Low for Meta was the Bear Cycle bottom of the Inflation Crisis while Tesla's Channel Down has been the picture of its underperformance for almost a year relative to the rest of the market (and the Magnificent 7 in particular).
However it shouldn't be overlooked that such cost driven news are fundamentals capable of turning the profitability of a company around and Meta's case is such a representative example. Meta was massively oversold in November 2022 (-75% from ATH) and similarly Tesla is massively oversold now (-60% from ATH). Meta managed to completely recover and smash through to new All Time Highs (+38% from previous ATH). In November 2022 it was all doom and gloom for the social media giant and it is worth searching for news headlines at the time to see the similarities with Tesla's situation today.
Time will tell of course, but we wanted to bring this comparison to you and help you draw your own conclusions.
-------------------------------------------------------------------------------
** Please LIKE 👍, FOLLOW ✅, SHARE 🙌 and COMMENT ✍ if you enjoy this idea! Also share your ideas and charts in the comments section below! This is best way to keep it relevant, support us, keep the content here free and allow the idea to reach as many people as possible. **
-------------------------------------------------------------------------------
💸💸💸💸💸💸
👇 👇 👇 👇 👇 👇

Tesla Set to Lay Off More Than 10% of its StaffIn a recent development, Tesla ( NASDAQ:TSLA ), the electric vehicle (EV) giant, has announced plans to lay off more than 10% of its global workforce, marking a significant shift in its operational strategy. This decision comes amidst a series of challenges facing the company, including declining vehicle deliveries and the abandonment of its plans for an inexpensive car.
According to reports from tech publication Electrek, Tesla ( NASDAQ:TSLA ) aims to streamline its operations by identifying critical team members and reducing production at Gigafactory Shanghai. Additionally, the company has paused some stock rewards and canceled annual reviews for certain employees. These measures signal a concerted effort by Tesla to navigate through a period of market turbulence and streamline its operations for future growth.
With approximately 15,000 workers expected to be affected by the layoffs, Tesla's ( NASDAQ:TSLA ) workforce reduction reflects a strategic realignment in response to changing market dynamics. Despite its status as the world's largest automaker by market value, Tesla ( NASDAQ:TSLA ) has encountered challenges in recent quarters, including a decline in vehicle deliveries – its first in nearly four years.
The announcement also comes at a pivotal time for Tesla ( NASDAQ:TSLA ), as it prepares to report its quarterly earnings on April 23. Investors and industry analysts will closely monitor these results to gauge the company's financial performance and its ability to navigate through current market challenges.
Furthermore, Tesla's decision to abandon plans for producing an inexpensive car underscores the shifting priorities within the EV industry. While CEO Elon Musk has long championed the goal of making affordable EVs accessible to the masses, the company's strategic pivot reflects the need to adapt to changing market dynamics and consumer preferences.
Despite these challenges, Tesla ( NASDAQ:TSLA ) remains a dominant force in the EV market, with its innovative technology and brand recognition continuing to drive interest among consumers. However, as competition intensifies and market conditions evolve, Tesla ( NASDAQ:TSLA ) faces mounting pressure to deliver sustainable growth and maintain its position as a market leader.
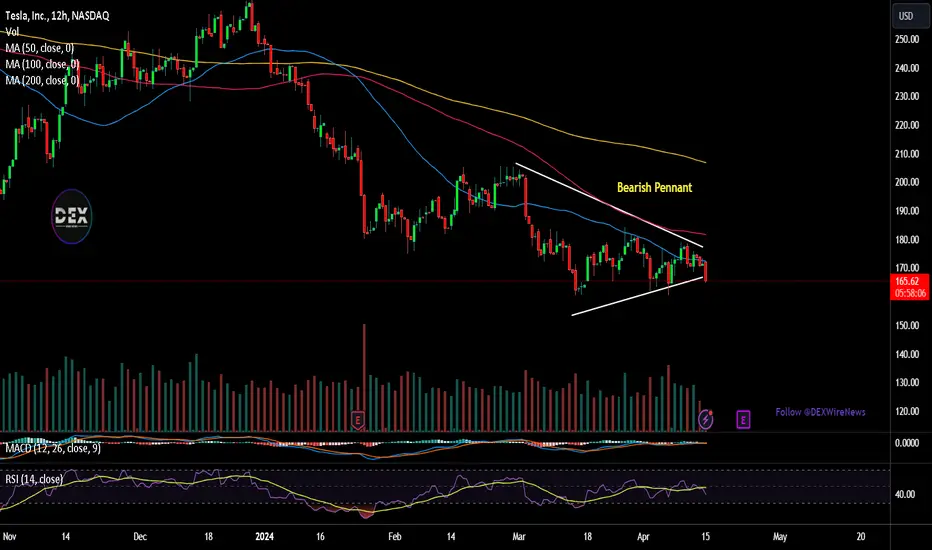
Technical Outlook
Tesla Inc. ( NASDAQ:TSLA ) stock is down 3.22% with a Relative Strength Index (RSI) of 39.72 indicating an oversold position for the stock. The Monthly price chart indicates a Bearish Pennant for the stock.
Tesla picking up Big money demandTesla appears to be setting up for a short squeeze. Bears may find themselves in trouble as the stock could break above the resistance line typically observed among retail investors. This breakout might prompt some bears to exit their positions and lure in breakout longs. However, the price is likely to retreat below the trend line, enticing more bears to enter short positions. Once the breakout longs are stopped out, the price may rally above the previous high, catching bears off guard once again. Notably, major bears who have sold during rallies up to $185 likely have their stop-loss orders just above, as indicated by the green box. The price is expected to sweep through this liquidity, attracting more long positions from institutional investors. The next target is just above the zone around $200.

TESLA LONG TERM VIEWId be very cautious on being long on Tesla right now. Theres better stocks out there right now to be long on.
Tesla has a large zig zag behind it, which has a high likelyhood of pushing prices a lot lower.
If we start failing now, and cant hold this current zone, and even breaking 150$ is the last straw, this stock is toast and can see a drop to 120-100 dollars.
One possibility that I have labeled here is a bounce up in the coming weeks now to trap long buyers before we get our move down to 120ish.
I would not be long here.

Rates putting Tesla to Bed OR New Truck = New Highs?Major resistance is ahead. But, If you look at the RSI it made a higher high on the large time frame. I think this needs to reach the high to match SNP and nas daq.
Bullish Divergence!

What Everyone Is Thinking But To Scared To Say...All hypotheticals, something to ponder on.
I like to use the 2 day time frame when looking at moving averages because they uniformly react to them much cleaner and more predictable then shorter/longer term time frames.
Not only is Elon under fire from wall street and investment groups like no other period in time, his own board of directors are trying to boot him out/he may want out himself (Hence the purchase of twitter, this was his way to exit in a none scarce way to the publics eye).
At the technical view point I am watching this orange 600 day moving average for a break below, the only other time this happened we had a fake break down and a massive pump up (circled in white).
The 55 & 200 day moving averages are THE most respected on this chart and which we have already been rejected by before the fall.
Conclusion:
The 600 day MA is support (for now) and if we break it, watch for a bottom to form around our volume gaps.
Worst case scenario is Tesla gets crushed by interest rates and china competitor.
Best case scenario is Tesla cuts staffing, rates get cut and more money is printed with the china competitor slowing growth.

TSLASharing without comment.
"The Biggest Loser in the "Magnificent Seven" Could Soar 1,140%, According to Cathie Wood's Ark Invest"
And this is the chart.
This sweetheart is also predicting Bitcoin is going above $1M.

TSLA levelsIf 165 holds then i would think tsla has a bounce to at least 210 in store. If 165 breaks i see 113 being tested.

TSLA SHORT TREND REVESE The Tsla Bull Trend is no more. Utilizing Schiff pitchfork and trend lines, with recent supply chain issues and the amount of shares used to cover twitter deal, tsla bear trend is here.

TSLA breaks through downward resistance trendTSLA has recently broken through downward resistance trend line turning it into a support line.
TSLA has been on a long downward trend and recently broke through
stock has held breakout past few periods giving confidence in new trend
RSI still remains below 50 though which is bearish sign.
Should be cause for some optimism of a turn around. Keep in mind though TSLA products are not cheap and sensitive to economic swings. Economy is on shaky grounds so buying this low should be done with a long term horizon.

Tesla, Inc. New updated X Right Prices.Tesla, Inc. New updated X Right Prices.
Watch for the bearish move.
Next Price $180.47, $180.44 follow by $180.80.
At This price which is already confirmed based on the calculation it will create a short bearish double top and the price will not find a support over 27th March, 2024. 2nd reason, Market left a trap during week 1, April at $168.87 & $165.71
May touch the following:
$181.12
$181.23
$181.55

247$ in 3-4 weeks247$ is the target for the next 3 to 4 weeks. There is only one way this can play out based on the patterns we clearly see. Bullish divergence on daily, weekly and monthly on the rsi. We are going higher. W-reversal pattern bulish to the upside, we have broken out of the downward sloping channel. This company is solving a real world problem, making EV's and saving the enviorment. They are gonna be the first with totaly selfdriving. Musk is a true hero

$TSLA chart reading - looking at the next two yearsUsing my own personalized chart notes this an explanation of what i see. Regardless of what method you use the same points of resistance and support are usually found. Im just looking at the geometric layout of the trend lines created by those points and the energy of "belief", how many systems will note this trend, etc. There you can really see any manipulation, which usually occurs based on a new forming trend line, the 2nd to 5th occurrence can become a pivotal point. Once points occur there begins to be an apex of non change. This forms a spoke, on powerful trend line convergence. It almost acts like a wheel with change in notable degrees of the trend line seperation.

Is Tesla at the bottom of a big flag pattern?Here we can see tesla possibly being at support at the bottom of this huge flag pattern, we are waiting for this to explode.
It also can break down for a capitulation before it goes up so, be aware

$TSLA DOUBLE BOTTOM $206 BEFORE 1Q EARNING A double bottom pattern is a well-known charting formation in technical analysis that signifies a significant shift in trend and a reversal of momentum from a previous downward movement in market trading. It illustrates the decline of a security or index, followed by a recovery, another decline to the same or similar level as the initial drop, and ultimately another recovery (which could potentially lead to a new upward trend).
- Elon Musk, the CEO of $Tesla, has officially announced that the company will introduce its Robotaxi during a highly anticipated unveiling event scheduled for August 8th.
-$Tesla's CEO Elon Musk is scheduled to meet with Indian Prime Minister Narendra Modi in India to discuss and unveil the company's investment plans.
NASDAQ:TSLA Institutional Holdings
-Increased Positions 1,615 66,420,077
-New Positions 333 7,940,604
$160 BOTTOMMMMMM (SUPPORT)
$183 RESITANCE (NEED TO BREAK)

TESLA Expected Growth! BUY!
My dear subscribers,
This is my opinion on the TESLA next move:
The instrument tests an important psychological level 164.86
Bias - Bullish
Technical Indicators: Supper Trend gives a precise Bullish signal, while Pivot Point HL predicts price changes and potential reversals in the market.
Target - 175.58
My Stop Loss - 158.48
About Used Indicators:
On the subsequent day, trading above the pivot point is thought to indicate ongoing bullish sentiment, while trading below the pivot point indicates bearish sentiment.
———————————
WISH YOU ALL LUCK
