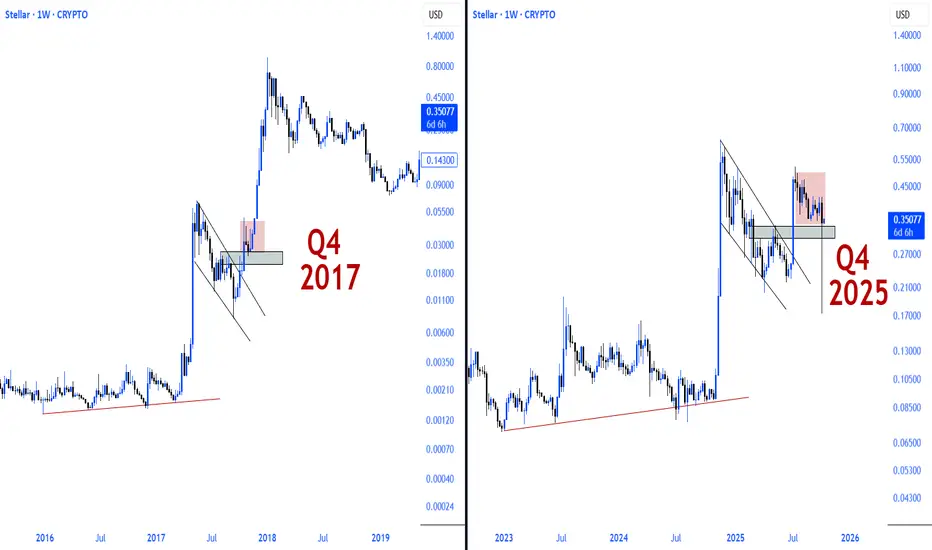
The 2017 and 2025 $XLM structures are strikingly similar.The 2017 and 2025 CRYPTOCAP:XLM structures are strikingly similar.
In 2017, a breakout occurred following a prolonged descending wedge formation, which then began a parabolic run after a brief accumulation phase above the demand zone.
The 2025 structure also forms a similar technical foundation.
Technical reflections of historical cycles.
Same structure, different cycle. However, market psychology and price behavior are shaped similarly.
While times may change, the recurrence of technical patterns is the clearest indicator of cyclical nature.
Dynamics that worked in the past are returning to the scene in the new cycle.
XLM is once again recapturing its historical rhythm.
XLM is the inseparable shadow of XRP.
If XRP runs, XLM will surely follow.
Trade ideas
XLM trade idea. October 2025Hello this is my first ever trade idea what I have shared. I am here to learn , so any constructive feed back is more than welcome :)
After an impulsive move, I identified a bull flag with inverse H&S pattern. After price broke the neckline I decided to open the long position at the level 0,3974 with TP $0,85 and SL $0,29.
With overall market uptrend and correlation with XRP movements in the past I expect a bullish scenario to happen after XRP ETF decision will be made by SEC on 26th of October.

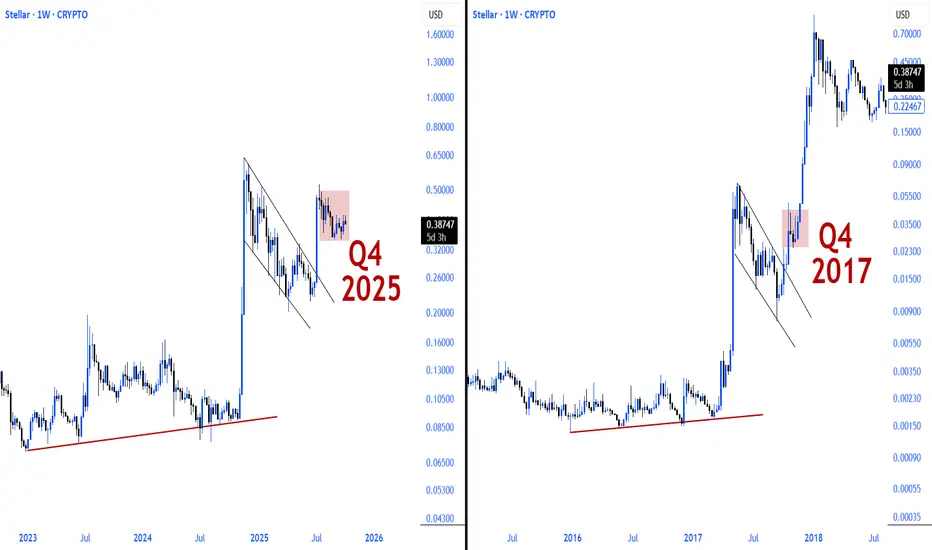
$XLM \ Stellar running itThe 2017 and 2025 structures on XLM weekly chart are strikingly similar.
In both periods, a breakout occurred after a prolonged descending wedge formation.
The breakout in 2017 was followed by an aggressive rally. The 2025 structure is forming a similar technical foundation.
Technical reflections of historical cycles.
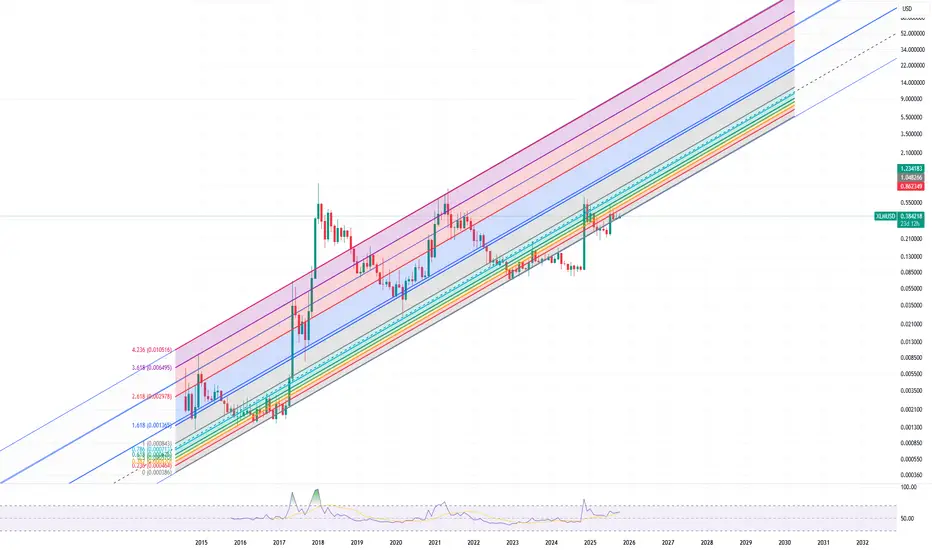
XLM Rainbow ChartBased on previous low and previous highs it seems like this rainbow chart is accurate. I took it to 2030 to see long term potential.
Stellar is ready to shock the crypto world- update on this analysis:
- as it stands, Stellar is probably the single best risk adjusted return trade you can find in the crypto space
- the target of the smaller wedge is around 50 cents however the big macro trade is confirmed with a new monthly higher high at which point the target is substantially higher - around 5$
XLM The monthly boxes are pulled out into mid October so we'll see how this plays out until then.
Pink = month
Grey = week
Red = day
Orange = 4hr

$XLM , my favourite one in the entire spaceVery constructive price action here, well defined boundaries

XLM to $4.00XLM has fluctuated between the $0.07 support and $0.50 resistance for years, testing the resistance three times. Now, it may break the resistance and reach $4.00.

XLMUSD getting ready for an explosive break-out.Stellar (XLMUSD) has been trading within a Descending Triangle since the July 18 High and currently is ranging within its Support level and the 1D MA50 (blue trend-line).
A similar Ascending Triangle back in May - June, rallied aggressively to its 2.0 Fibonacci extension (the July 18 High) after breaking above both its Lower Highs trend-line and the 1D MA50. Even the 1D RSI sequences among the two fractals are similar.
As a result, if the price breaks above the 1D MA50 - Lower Highs trend-line, we will turn bullish, targeting 0.78000 (Fib 2.0 ext).
-------------------------------------------------------------------------------
** Please LIKE 👍, FOLLOW ✅, SHARE 🙌 and COMMENT ✍ if you enjoy this idea! Also share your ideas and charts in the comments section below! This is best way to keep it relevant, support us, keep the content here free and allow the idea to reach as many people as possible. **
-------------------------------------------------------------------------------
💸💸💸💸💸💸
👇 👇 👇 👇 👇 👇

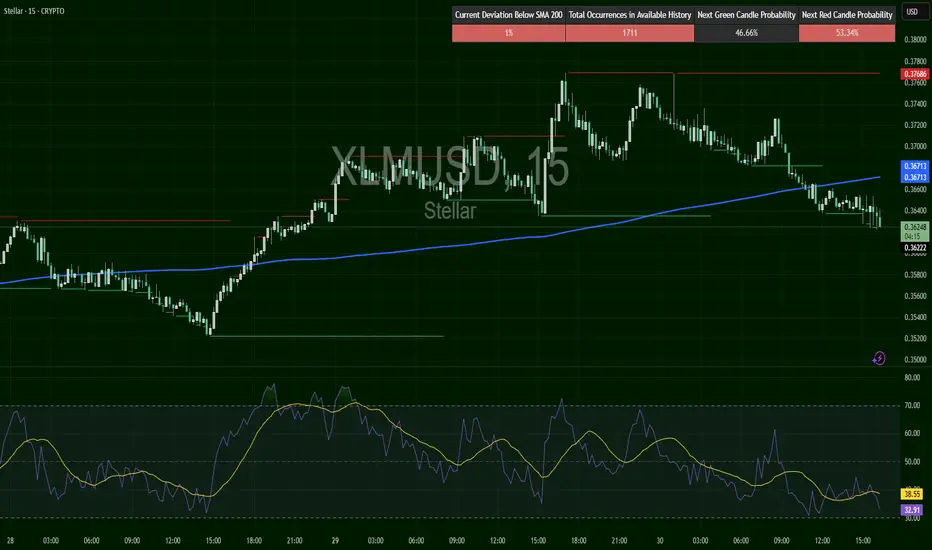
XLM/USD – Rebound Attempt After Drop🟠 Struggling below SMA200 ($0.397)
Stellar trades at $0.384, below trend resistance after heavy selling. RSI at 58, showing mild recovery momentum. Resistance at $0.405, support at $0.378.
📖 Keywords: #XLMUSD #Stellar #AltcoinWatch #CryptoRebound

XLMUSD Long Idea: Bullish Retest of Flipped Support LevelHello TradingView Community,
This post outlines a potential long trade setup for the Stellar / US Dollar (XLMUSD) pair, based on the 15-minute timeframe.
Technical Analysis:
The chart is currently showing a bullish structure. We can identify a key horizontal price level at approximately $0.39533305. This level previously acted as a resistance zone, where the price struggled to break through.
Recently, the price has successfully broken out above this resistance and is now consolidating on top of it. This is a classic "resistance-turned-support" pattern. The trading idea is based on the expectation that this former resistance will now act as a new support floor. A successful hold and bounce from this area would suggest a continuation of the bullish momentum.
Trade Setup:
The long position tool on the chart visualizes a potential trade plan based on this scenario:
Entry: Approximately $0.39533305 (at the retest of the new support).
Stop Loss: $0.37585674 (placed below the key support level to invalidate the idea if the support fails).
Take Profit: $0.45667653 (targeting a new higher high in the trend).
This setup provides a structured plan with a favorable risk-to-reward ratio for a potential move higher.
Disclaimer: This analysis is for educational and discussion purposes only and should not be considered financial advice. Trading cryptocurrencies involves significant risk. Please conduct your own due diligence and manage your risk appropriately.

XLM/USD – Breakdown Risk🔴 SHORT under $0.365 – target $0.362
Stellar trades at $0.3636, slipping below SMA200 ($0.367). Resistance sits at $0.376, support at $0.362. RSI at 38, bearish momentum building. Break under $0.362 could open further downside.
📖 Keywords: #XLMUSD #Stellar #AltcoinBearish #CryptoWatch
XLM is trendline orientedFirstly, not a fan of lines in charts, but XLM is the only expectation. Every coin has its own breathing style.
After XLM breaks the most recent trendline, I expect to go very fast, according to previous bull market trendline breakouts.
XLM Bull market = breakout when trendline breaks out (and fast)
XLM Bear market = good time to buy when trendline breaks (and slow)
Best regards to everyone :)

XLM | Something is brewingI think XLM can 3x + from here. Seeing a nice triangle pattern from here and FVG mitigation.

XLM Week 38Weekly boxes are grey showing weekly high, lows and median ranges
daily level in red
4hr levels/ trend in orange
1hr level in yellow

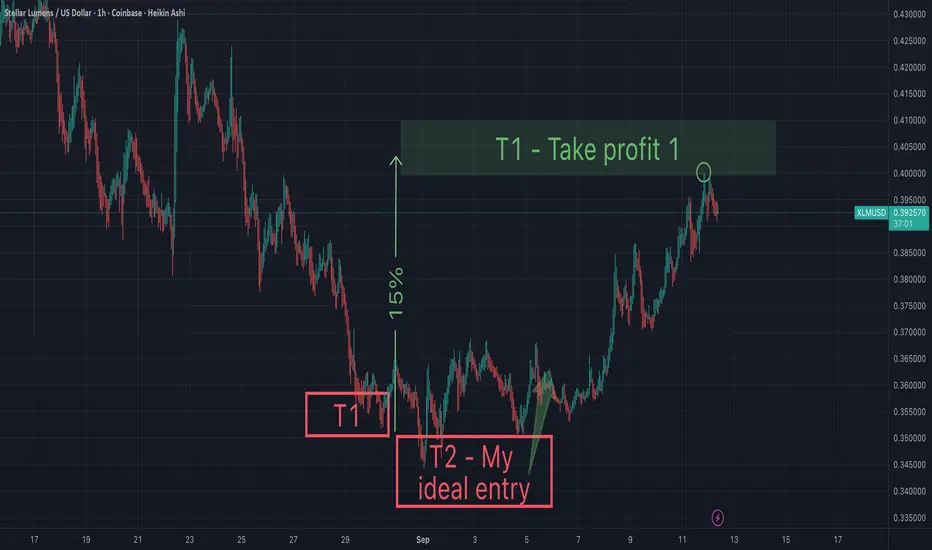
Xlm - Take profit targetI'm anticipating my take profit to be hit this weekend. I bought the bottom last Sunday, and I'm up 14%, so if my target hits, I'm up 20%. Xlm may continue up beyond my take profit target, but I don't want to be greedy. May the trends be with you.

You will ask yourself, "how did he know Xlm would do that"?On Aug 30th I suggested that Xlm would drop lower into my T2, then bounce to my "take profit 1". I am grateful this played out perfectly.
Now the question remains, will we get a pullback or continue up to my T2? What are your thoughts? I'd like to hear from you and get a sense of sentiment.
The Black Hole Swallowing $XLMStellar Lumens is showing clear signs of a bearish structure despite recent volatility. The chart suggests that price action may attempt a relief rally toward the $0.47 zone, but this move looks more like a corrective upswing within a broader downtrend.
Unless CRYPTOCAP:XLM can establish strong support above that level, the probability remains high that it will resume its descent, with a decisive move back below $0.34 on the horizon. In short, the gravitational pull of the broader market trend appears stronger than any short-term bounce.
Patience and risk management are critical here..this is less of a breakout and more of a classic bull trap in the making.

XLM/USD – Rejection Near Resistance🔴 SHORT below $0.386 – target $0.372
Stellar trades at $0.382, stalling under $0.386 resistance. SMA200 nearby at $0.369. Resistance: $0.386, support: $0.369. RSI rolled over from 63 → 52, confirming bearish shift. Failed breakout hints at pullback.
📖 Keywords: #XLMUSD #Stellar #CryptoReversal #AltcoinWatch #BearishSetup

**XLM Analysis** Stellar (XLM) is currently exhibiting classi
**XLM Analysis**
Stellar (XLM) is currently exhibiting classic range-bound behavior, consolidating after its recent price movements. The key psychological and technical support level to watch is **$0.105**. A sustained break below this could trigger a sell-off towards the next significant support near **$0.095**. Conversely, the immediate resistance sits around **$0.115**, with a more formidable barrier at **$0.125**. A decisive daily close above $0.125, accompanied by high trading volume, could be the catalyst for a stronger upward move, potentially targeting the **$0.14** region.
Fundamentally, the Stellar network continues to focus on its core strengths: cross-border payments and asset tokenization. Recent developments around its Soroban smart contracts platform aim to enhance its utility and attract developers. However, like many altcoins, XLM's price is heavily influenced by broader market sentiment and Bitcoin's trajectory.
The trading volume has been average, suggesting a period of accumulation or distribution before the next significant price swing. The Relative Strength Index (RSI) is hovering around neutral territory, indicating a balance between buying and selling pressure.
In the short term, expect continued consolidation between $0.105 and $0.125. Traders should monitor Bitcoin's momentum and overall crypto market cap flows, as these will be primary drivers. A break from this range with expanding volume will likely dictate the next directional trend.

XLM | some level explanationGet your C0tt0nC4ndy dose of TA with me from time to time.
Just posting quickly while waiting in line.
there are notes on screen read them

XLM/USD – Stalling at Resistance🔴 SHORT below $0.366 – target $0.360
Stellar trades at $0.365, capped by resistance at $0.366. The 200 SMA at $0.360 provides support. RSI at 56 is stable but not showing strong bullish drive. If XLM fails to clear $0.366, a retrace to $0.360 is likely.

The XLM chart looks STELLARSince making a High in January of 2018 at just shy of a dollar.
This Asset has made subsequent higher lows during the following two bear markets for #Altcoins. Suggesting strong accumulation from "smart" money.
The last bear was an extended bear for alts. Which allowed for even more time to accumulate this asset.
Leading to a pressure cooker situation with a clear level that will mark the explosion.
The horizontal level at around 52 cents is clear level for which this asset must close to ignite what could possible be a substantial rally!
