#XTZUSDT 1D#XTZ is moving inside a descending channel on the daily timeframe and is currently sitting on the support zone. For the bullish scenario, it must bounce from this zone with strong volume. Do not enter here yet — volume is weak, and the RSI suggests there is still room for further downside. If a succ

Algotrading XTZUSDTPress "Grab this chart", run strategy tester for entire history and make sure that is good time for a long to yellow line

XTZ USDT LONG SIGNAL---
📢 Trade Idea: XTZ/USDT
Type: Long
Entry Zone: 0.579 – 0.590
🎯 Take-Profit Targets (Partial Exits):
• TP1 = 0.604
• TP2 = 0.616
• TP3 = 0.626
• TP4 = 0.637
• TP5 = 0.665
🛑 Stop-Loss: 0.568
⏱ Timeframe: 1H
⚖️ Risk/Reward Ratio: 2.86
💥 Suggested Leverage: 5x – 10x
---
🧠 Technical Analysis Sum

XTZ USDT LONG SIGNAL---
📢 Signal Alert
🔹 Pair: XTZ / USDT
📈 Trade Type: Long
💰 Entry: Market Price
🎯 Take-Profit Targets (Partial Management):
▫️ TP1 = 0.626
▫️ TP2 = 0.653
▫️ TP3 = 0.680
🛑 Stop-Loss: 0.600
📊 Timeframe: 1H
⚖️ Risk/Reward Ratio: 6.0
📌 Suggested Leverage: 5x – 10x
⚠️ Capital management is mandatory.

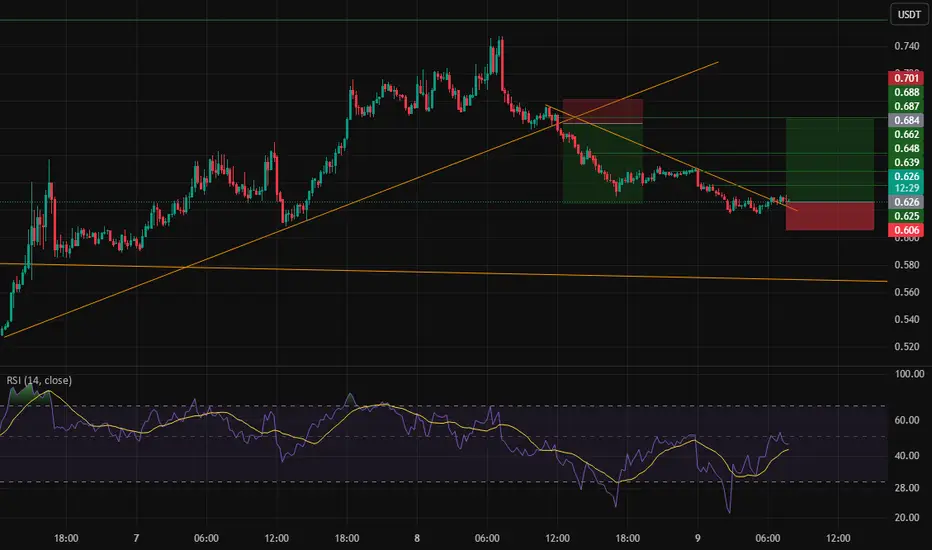
XTZ USDT LONG SIGNAL ---
📢 Signal Alert
🔹 Pair: XTZ / USDT
📈 Trade Type: Long
💰 Entry: 0.626
🎯 Take-Profit Targets (Partial Management):
▫️ TP1 = 0.639
▫️ TP2 = 0.648
▫️ TP3 = 0.662
▫️ TP4 = 0.683
🛑 Stop-Loss: 0.605
📊 Timeframe: 1H
⚖️ Risk/Reward Ratio: 5.73
📌 Suggested Leverage: 5x – 10x
⚠️ Capital management is m
XTZ USDT SHORT SIGNAL---
📢 Signal Alert
🔹 Pair: XTZ / USDT
📉 Trade Type: Short
💰 Entry Zone: 0.790 – 0.845
🎯 Take-Profit Targets:
TP1 = 0.759
TP2 = 0.695
TP3 = 0.625
🛑 Stop-Loss: 0.846
📊 Timeframe: 1H
⚖️ Risk/Reward Ratio: 3.0
📌 Suggested Leverage: 3x – 5x
⚠️ Capital management is mandatory.
Please analyze the

XTZUSDT Forming Falling WedgeXTZUSDT is forming a clear falling wedge pattern, a classic bullish reversal signal that often indicates an upcoming breakout. The price has been consolidating within a narrowing range around $0.65 USDT, suggesting that selling pressure is weakening while buyers are beginning to regain control amid

BUY TEZOS NOWWBased on the XTZ/USDT 30-minute chart using Heikin Ashi candles:
• Current Price: The price is around $0.5636 (as of 20:49 on November 06, 2025).
• Support Zone: The chart shows a strong support area around $0.5252. The price has touched and held firm above this level in recent days, showing consoli

XTZ/USDT A Pattern of Strength in Market Weakness📍 The chart is forming a Livermore-style expanding wedge —
a structure where each price swing grows wider, and volatility increases.
📌 The current zone may be a key turning point for the trend.

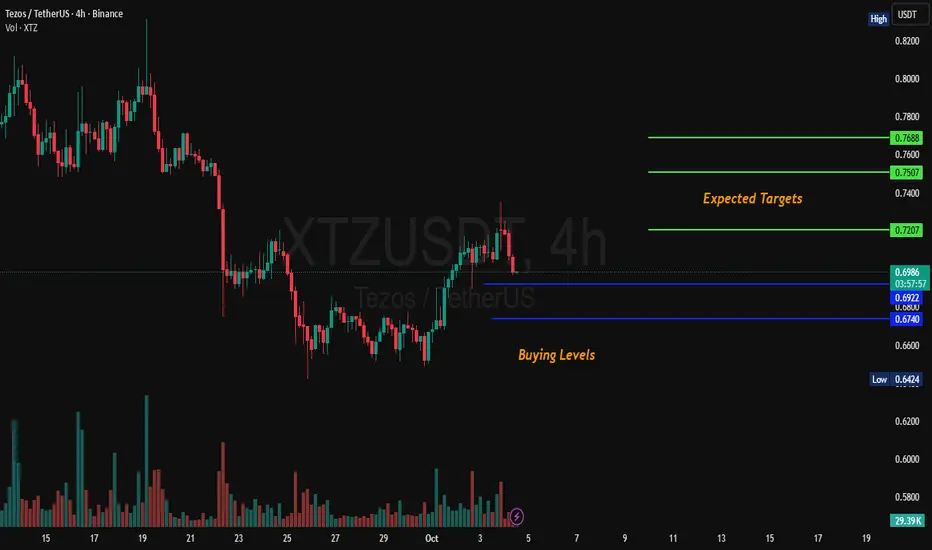
XTZ 4H Analysis XTZ Has started upward momentum. Key buying area are marked as 0.682 & 0.675. Possible targets are also given on the chart. NFA DYOR
See all ideas
Summarizing what the indicators are suggesting.
Oscillators
Neutral
SellBuy
Strong sellStrong buy
Strong sellSellNeutralBuyStrong buy
Oscillators
Neutral
SellBuy
Strong sellStrong buy
Strong sellSellNeutralBuyStrong buy
Summary
Neutral
SellBuy
Strong sellStrong buy
Strong sellSellNeutralBuyStrong buy
Summary
Neutral
SellBuy
Strong sellStrong buy
Strong sellSellNeutralBuyStrong buy
Summary
Neutral
SellBuy
Strong sellStrong buy
Strong sellSellNeutralBuyStrong buy
Moving Averages
Neutral
SellBuy
Strong sellStrong buy
Strong sellSellNeutralBuyStrong buy
Moving Averages
Neutral
SellBuy
Strong sellStrong buy
Strong sellSellNeutralBuyStrong buy
Displays a symbol's price movements over previous years to identify recurring trends.