XVG Compressing Inside a Symmetrical Triangle StructureXVG is currently consolidating inside a symmetrical triangle pattern on the daily timeframe, indicating volatility compression and market indecision.
Price is trading near the lower half of the triangle, where reactions have previously occurred. From this zone, the market may attempt a move back to
Related pairs

XVG TRADE IDEA ON 30m.XVG is in bullish trend, did a bullish BOS. I have marked unmitigated Order block with FVG as POI for long, when price comes in POI then take trade after confirmation.

$xvg again bull ??📌 SGX:XVG Elliott Wave structure is clearly visible on the 4H timeframe ✅
📌The 3rd wave is already completed, and price is now pulling back to form the 4th wave ✅
📌The green marked area is a key support zone — the 4th wave must hold this zone ⚠️
📌If this support holds properly:
👉 Price can move

XVGUSDT Forming Bullish MomentumXVGUSDT is forming a clear bullish momentum pattern, a classic bullish reversal signal that often indicates an upcoming breakout. The price has been consolidating within a narrowing range, suggesting that selling pressure is weakening while buyers are beginning to regain control. With consistent vol
XVG/USDTOver 323days formed huge classic box text book pattern indicating strong zone we can see final shakeout its time for reversal targeting 200% for this structure

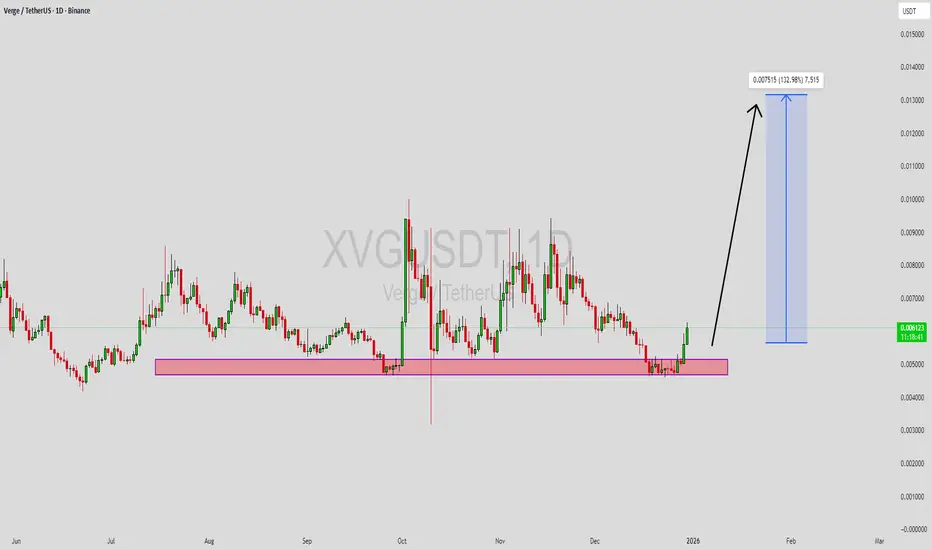
XVGUSDT BUYXVGUSDT – 1D | Range → Expansion Cycle, Swing Plan with Targets
XVG has been respecting a very clear “range → expansion” behaviour on the daily chart.
Each time price spends a long period inside a horizontal range, it is followed by a sharp vertical expansion leg. The previous cycles are marked on

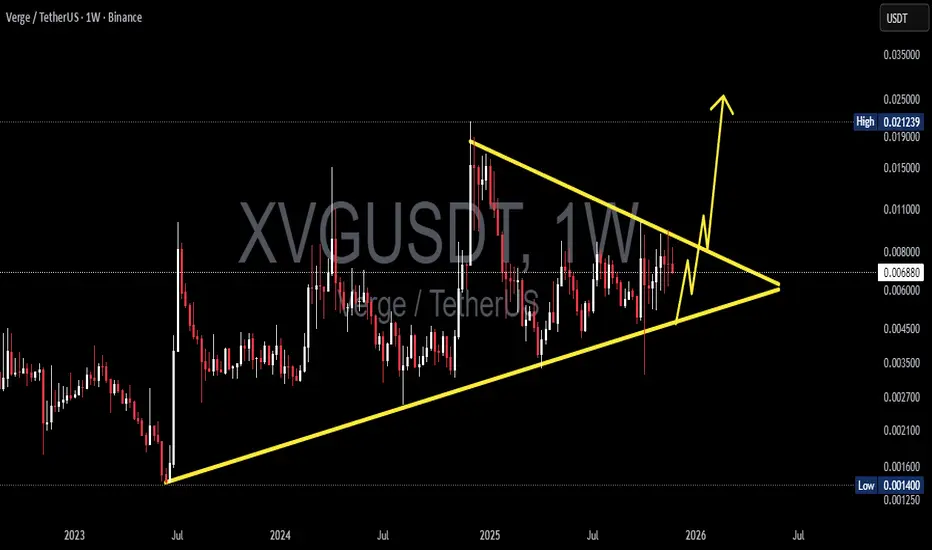
XVG/USDT — Symmetrical Triangle Nearing Breakout?XVG is approaching one of its most critical technical moments in the last two years. Price has been compressing inside a large Symmetrical Triangle since mid-2023, defined by:
1. Higher Lows showing steady accumulation from smart money, and
2. Lower Highs showing persistent supply pressure.
Bo
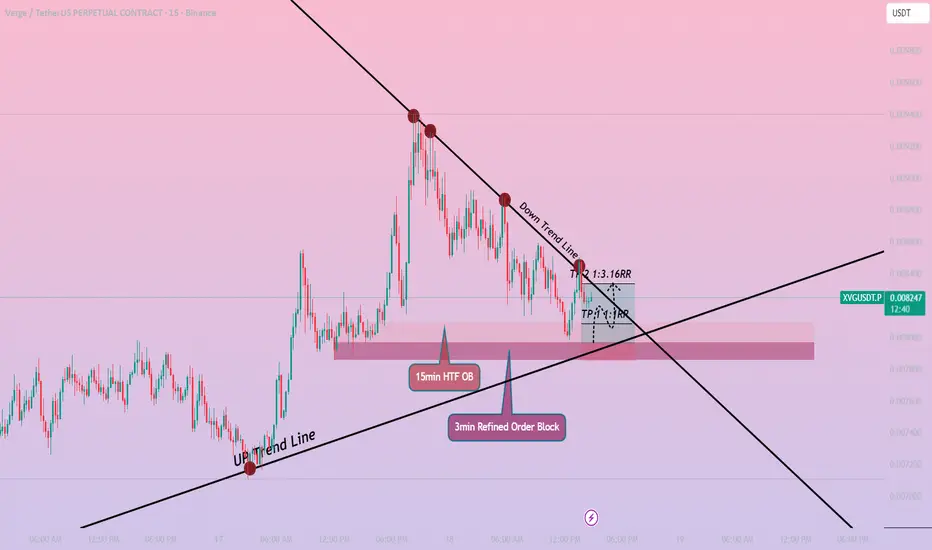
XVG/USDT Analysis using Trendlines and OB'sIn this XVG/USDT setup, the market is showing a clear HTF bullish structure on the 15-minute timeframe, while the LTF (3-minute) is still in a corrective downtrend. This type of HTF–LTF mismatch usually indicates that the market is searching for liquidity before aligning back with the major trend.
Verge · XVG Market LookVerge BINANCE:XVGUSDT is now pressing into a big resistance zone that has stopped price for more than two years. The trendline under the price keeps rising, and that means buyers are getting stronger. Sellers in that zone look weaker. Volume is also picking up, which usually shows interest before

XVGUSDT Analysis — Ready for a Spot Buy👋 Welcome to TradeCityPro!
Let’s move on to the analysis of XVG, another privacy-focused coin similar to XMR, and take a closer look at its current market structure.
🌐 Overview of Bitcoin
Before starting the analysis, let me remind you once again that we’ve moved the Bitcoin analysis section to

See all ideas
Summarizing what the indicators are suggesting.
Oscillators
Neutral
SellBuy
Strong sellStrong buy
Strong sellSellNeutralBuyStrong buy
Oscillators
Neutral
SellBuy
Strong sellStrong buy
Strong sellSellNeutralBuyStrong buy
Summary
Neutral
SellBuy
Strong sellStrong buy
Strong sellSellNeutralBuyStrong buy
Summary
Neutral
SellBuy
Strong sellStrong buy
Strong sellSellNeutralBuyStrong buy
Summary
Neutral
SellBuy
Strong sellStrong buy
Strong sellSellNeutralBuyStrong buy
Moving Averages
Neutral
SellBuy
Strong sellStrong buy
Strong sellSellNeutralBuyStrong buy
Moving Averages
Neutral
SellBuy
Strong sellStrong buy
Strong sellSellNeutralBuyStrong buy
Displays a symbol's price movements over previous years to identify recurring trends.
Frequently Asked Questions
The current price of Verge / TetherUS (XVG) is 0.005791 USDT — it has fallen −3.82% in the past 24 hours. Try placing this info into the context by checking out what coins are also gaining and losing at the moment and seeing XVG price chart.
Verge / TetherUS price has risen by 3.52% over the last week, its month performance shows a −3.55% decrease, and as for the last year, Verge / TetherUS has decreased by −11.86%. See more dynamics on XVG price chart.
Keep track of coins' changes with our Crypto Coins Heatmap.
Keep track of coins' changes with our Crypto Coins Heatmap.
Verge / TetherUS (XVG) reached its highest price on Jun 6, 2021 — it amounted to 0.080000 USDT. Find more insights on the XVG price chart.
See the list of crypto gainers and choose what best fits your strategy.
See the list of crypto gainers and choose what best fits your strategy.
Verge / TetherUS (XVG) reached the lowest price of 0.001400 USDT on Jun 15, 2023. View more Verge / TetherUS dynamics on the price chart.
See the list of crypto losers to find unexpected opportunities.
See the list of crypto losers to find unexpected opportunities.
The safest choice when buying XVG is to go to a well-known crypto exchange. Some of the popular names are Binance, Coinbase, Kraken. But you'll have to find a reliable broker and create an account first. You can trade XVG right from TradingView charts — just choose a broker and connect to your account.
Crypto markets are famous for their volatility, so one should study all the available stats before adding crypto assets to their portfolio. Very often it's technical analysis that comes in handy. We prepared technical ratings for Verge / TetherUS (XVG): today its technical analysis shows the sell signal, and according to the 1 week rating XVG shows the sell signal. And you'd better dig deeper and study 1 month rating too — it's sell. Find inspiration in Verge / TetherUS trading ideas and keep track of what's moving crypto markets with our crypto news feed.
Verge / TetherUS (XVG) is just as reliable as any other crypto asset — this corner of the world market is highly volatile. Today, for instance, Verge / TetherUS is estimated as 3.87% volatile. The only thing it means is that you must prepare and examine all available information before making a decision. And if you're not sure about Verge / TetherUS, you can find more inspiration in our curated watchlists.
You can discuss Verge / TetherUS (XVG) with other users in our public chats, Minds or in the comments to Ideas.