ZEREBROUSDT Trading IdeaLikely a reversal to the upside from $0.02031 or $0.02004 provided the weekly order block is not mitigated.
The preferred position should be a long position.
Trade ideas
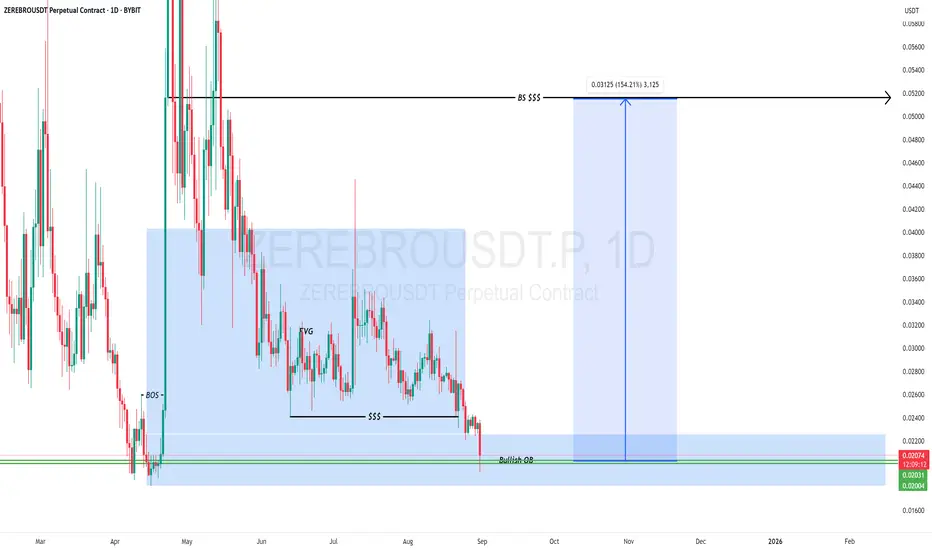
ZEREBRO/USDTKey Level Zone: 0.03100 - 0.03300
Live portfolio: binance.com/en/copy-trading/lead-details/4734386373409825025
Archived Portfolios: Available at the bottom of the linked page
LMT v2.0 detected.
The setup looks promising—price previously trended upward with rising volume and momentum, then retested this zone cleanly. This presents an excellent reward-to-risk opportunity if momentum continues to align.
Introducing LMT (Levels & Momentum Trading)
- Over the past 3 years (SINCE 2022), I’ve refined my approach to focus more sharply on the single most important element in any trade: the KEY LEVEL.
- While HMT (High Momentum Trading) served me well—combining trend, momentum, volume, and structure across multiple timeframes—I realized that consistently identifying and respecting these critical price zones is what truly separates good trades from great ones.
- That insight led to the evolution of HMT into LMT – Levels & Momentum Trading.
Why the Change? (From HMT to LMT)
Switching from High Momentum Trading (HMT) to Levels & Momentum Trading (LMT) improves precision, risk control, and confidence by:
- Clearer Entries & Stops: Defined key levels make it easier to plan entries, stop-losses, and position sizing—no more guesswork.
- Better Signal Quality: Momentum is now always checked against a support or resistance zone—if it aligns, it's a stronger setup.
- Improved Reward-to-Risk: All trades are anchored to key levels, making it easier to calculate and manage risk effectively.
- Stronger Confidence: With clear invalidation points beyond key levels, it's easier to trust the plan and stay disciplined—even in tough markets.
Whenever I share a signal, it’s because:
- A high‐probability key level has been identified on a higher timeframe.
- Lower‐timeframe momentum, market structure and volume suggest continuation or reversal is imminent.
- The reward‐to‐risk (based on that key level) meets my criteria for a disciplined entry.
***Please note that conducting a comprehensive analysis on a single timeframe chart can be quite challenging and sometimes confusing. I appreciate your understanding of the effort involved.
Important Note: The Role of Key Levels
- Holding a key level zone: If price respects the key level zone, momentum often carries the trend in the expected direction. That’s when we look to enter, with stop-loss placed just beyond the zone with some buffer.
- Breaking a key level zone: A definitive break signals a potential stop‐out for trend traders. For reversal traders, it’s a cue to consider switching direction—price often retests broken zones as new support or resistance.
My Trading Rules (Unchanged)
Risk Management
- Maximum risk per trade: 2.0%
- Leverage: 3x
Exit Strategy / Profit Taking
- Sell at least 70% on the 3rd wave up (LTF Wave 5).
- Typically sell 50% during a high‐volume spike.
- Move stop‐loss to breakeven once the trade achieves a 1.5:1 R:R.
- Exit at breakeven if momentum fades or divergence appears.
The market is highly dynamic and constantly changing. LMT signals and target profit (TP) levels are based on the current price and movement, but market conditions can shift instantly, so it is crucial to remain adaptable and follow the market's movement.
If you find this signal/analysis meaningful, kindly like and share it.
Thank you for your support~
Sharing this with love!
From HMT to LMT: A Brief Version History
HM Signal (Prototype) :
Date: 17/08/2023
- Early concept identifying high momentum pullbacks within strong uptrends
- Triggered after a prior wave up with rising volume and momentum
- Focused on healthy retracements into support for optimal reward-to-risk setups
HMT v1.0:
Date: 18/10/2024
- Initial release of the High Momentum Trading framework
- Combined multi-timeframe trend, volume, and momentum analysis.
- Focused on identifying strong trending moves high momentum
HMT v2.0:
Date: 17/12/2024
- Major update to the Momentum indicator
- Reduced false signals from inaccurate momentum detection
- New screener with improved accuracy and fewer signals
HMT v3.0:
Date: 23/12/2024
- Added liquidity factor to enhance trend continuation
- Improved potential for momentum-based plays
- Increased winning probability by reducing entries during peaks
HMT v3.1:
Date: 31/12/2024
- Enhanced entry confirmation for improved reward-to-risk ratios
HMT v4.0:
Date: 05/01/2025
- Incorporated buying and selling pressure in lower timeframes to enhance the probability of trending moves while optimizing entry timing and scaling
HMT v4.1:
Date: 06/01/2025
- Enhanced take-profit (TP) target by incorporating market structure analysis
HMT v5 :
Date: 23/01/2025
- Refined wave analysis for trending conditions
- Incorporated lower timeframe (LTF) momentum to strengthen trend reliability
- Re-aligned and re-balanced entry conditions for improved accuracy
HMT v6 :
Date : 15/02/2025
- Integrated strong accumulation activity into in-depth wave analysis
HMT v7 :
Date : 20/03/2025
- Refined wave analysis along with accumulation and market sentiment
HMT v8 :
Date : 16/04/2025
- Fully restructured strategy logic
HMT v8.1 :
Date : 18/04/2025
- Refined Take Profit (TP) logic to be more conservative for improved win consistency
LMT v1.0 :
Date : 06/06/2025
- Rebranded to emphasize key levels + momentum as the core framework
LMT v2.0
Date: 11/06/2025
- Fully restructured lower timeframe (LTF) momentum logic
📊 Trading Portfolio Performance Summary
Portfolio 1
🔗 View Report: drive.google.com/file/d/1D3OqEVR99Q32Kq-TzkUYmKHGrCqPP-7r/view?usp=drive_link
Period: 1 Sep – 20 Sep 2025 (20 days)
Profit / Loss: +80.27 %
Max Drawdown: 13.49 %
Win Rate: 31.88 %
Remarks: Exceptional short-term performance driven by high-momentum trades and disciplined risk control. Strong R:R despite a low win rate.
Portfolio 2
🔗 View Report: drive.google.com/file/d/1YK02px8QA6H2R5sdFeV-fU-nFh2SvX1n/view?usp=drive_link
Period: 20 Sep – 12 Oct 2025 (20 days)
Profit / Loss: +28.89 %
Max Drawdown: 13.11 %
Win Rate: 30.95 %
Remarks: Consistent execution with steady gains and maintained drawdown control. Focused on stability and risk management.
Portfolio 3 (Current)
🔗 Live Performance on Binance: binance.com/en/copy-trading/lead-details/4734386373409825025
Period: 12 Oct 2025 – Ongoing
Profit / Loss: (To be updated)
Max Drawdown: (To be updated)
Win Rate: (To be updated)
Remarks: Live portfolio in progress — focus on improving position management, refining entry filters, and maintaining consistent risk parameters for higher win efficiency.

$ZEREBRO Performing a bullish pennant A bullish pennant is a chart pattern in technical analysis that signals a continuation of an uptrend. It is formed when a sharp, strong upward price movement (the "flagpole") is followed by a short period of consolidation, creating a small symmetrical triangle (the "pennant"). A breakout above the pennant's upper trendline indicates that the uptrend will likely continue.

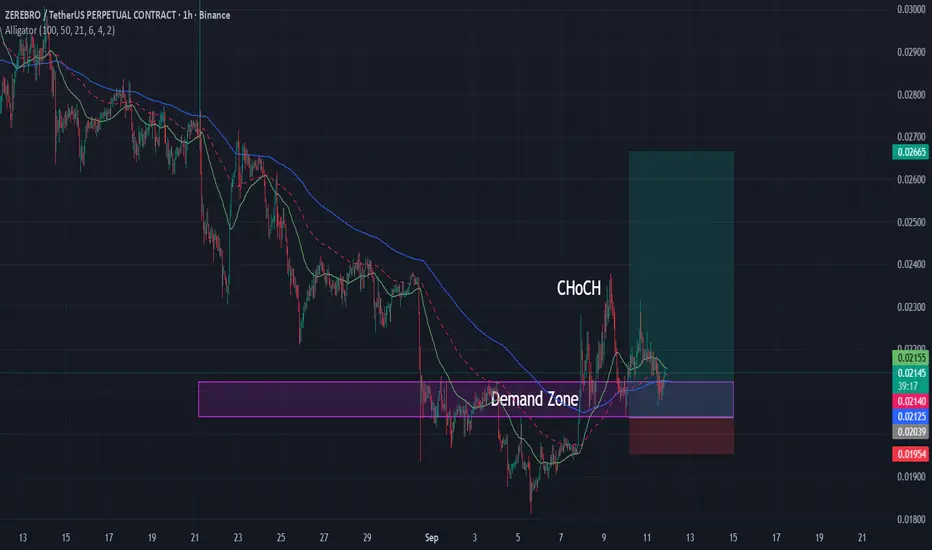
Bullish Setup: ZEREBORUSDT❇️ New Futures Signal
📈 Pair: ZEREBRO/USDT
⚡ Direction: Buy Long
🎚️ Leverage: 10x
Entry: 0.02105
Stop Loss (SL): ❌ 0.01950
Take Profits (TPs):
✅ TP1: 0.0236
✅ TP2: 0.0300
✅ TP3: 0.0350
💡 Reasoning: Price retesting demand zone after CHoCH → potential bullish continuation.
❇️ Always use proper risk management.
👉 Do you agree with this setup? Comment below 👇
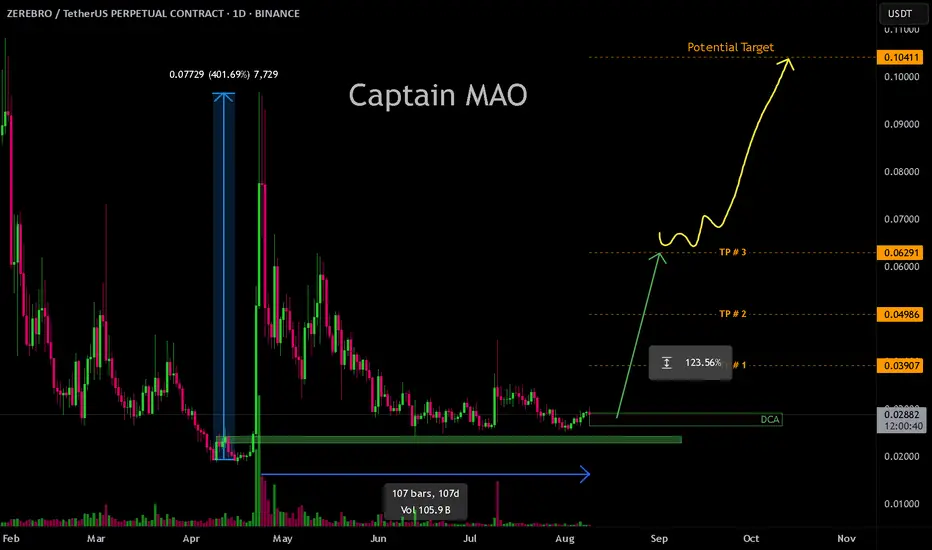
ZEREBRO/USDT - Higher!!!April 2025 was a breakout month for ZEREBRO, delivering an impressive +400% rally. Since then, price has been consolidating in a prolonged re-accumulation phase for over 100 days, with market structure showing strong hands defending the 0.025 zone. This level is acting as a key reversal base, suggesting whales are accumulating for the next impulsive leg. A breakout from the current range could open the path toward retesting previous highs and extending the bullish cycle.
ZEREBROUSDT Bullish Outlook with Precision Entrycore bullish bias is predicated on the observed completion of sell-side liquidity sweeps across the 4H, 2H, 1H, and 30M timeframes. Concurrently, buy-side liquidity (BSL) on the 30M timeframe is actively being targeted, with the 15M BSL already confirmed as "finished" within this larger zone.
targeting the 0.02701 price level. This specific price point presents a high-confluence zone, aligning with both the Fair Value Gap (FVG) identified on the 15M and 5M charts, and the Balance Price Range (BPR) from the 1H timeframe. These technical constructs suggest an area where price inefficiencies may be rebalanced before an upward continuation.

ZEREBRO Breakout📊 ZEREBRO/USDT – 4H Chart Analysis
ZEREBRO has broken out of the long-term descending trendline and is currently consolidating above the breakout zone, near the $0.0320–$0.0330 support (blue zone). This area also coincides with the 50 EMA, which price is now trading above for the first time in weeks — a potential signal of bullish reversal.
🔹 Bullish Outlook:
If price successfully retests this zone and holds, we could see a move towards the first resistance at $0.0411. Momentum and volume are gradually increasing, which supports this scenario.
🔹 Key Levels:
Support zone: $0.0320–$0.0330
May Low: $0.0283
Resistance 1: $0.0411
Resistance 2: $0.0486 (April Close)
📌 Watch for confirmation on the retest — a bullish candle or strong volume surge could provide a good entry opportunity. If rejected, price may revisit support at $0.0283.

Zerebro TAsignificant and confirmed shift from a bearish to a robust bullish market structure.
consistent bullish expansion, strategic

ZEREBRO LONG🧠 Technical Analysis
1. Historical Price Action
The asset saw a massive drop from above $0.20 to sub-$0.05 levels in early 2025.
Since then, price has mostly been range-bound, with a notable spike in late April but quickly retraced.
2. Current Structure
Higher lows are forming since the last spike, suggesting some accumulation or base building.
Price is attempting to break out of a consolidation zone, but no major breakout volume is visible in this chart.
3. Support and Resistance
Support: Around $0.035–$0.040 (where price repeatedly bounced)
Resistance: Around $0.060–$0.065 (area of previous spikes and wicks)
4. Heikin Ashi Candle Analysis
The recent candles are showing stronger bullish momentum, with minimal lower wicks, which is a bullish sign.
🔮 Bias
Bullish bias — cautiously optimistic.
Why:
The price is showing signs of accumulation, attempting to break out of a range.
Momentum is picking up, with higher lows and bullish Heikin Ashi candles.
However, we need a confirmed breakout above $0.060 with volume to fully shift into a bullish breakout phase.
✅ What to Watch For
Break and close above $0.060 on volume — bullish continuation.
Failure to break and fall below $0.040 — likely retest of lower support or prolonged consolidation.
Use trendline or moving averages to confirm trend shift (if not already present on your chart).

Short Setup Idea – ZEREBROUSDT (1H)Short Setup Idea – ZEREBROUSDT (1H)
Price is approaching a high-liquidity area just above the marked pink zone, where buy-side liquidity likely rests. Expecting a potential liquidity grab followed by a strong rejection. Targeting a short entry after a sweep of this zone with confirmation, aiming for downside continuation toward the previous demand level around 0.04326.

ZEREBROUSDTThis is the current outlook on $ZEREBRO.
This isn't a financial advice, apply proper risk management.


Zerebro autonomous AI system to 15x ??On the above 16hr chart price action has corrected 96%. A number of reasons now exist to be bullish. They include:
1) Price action and RSI resistance breakouts.
2) Trend reversal.
3) Regular bullish divergence. 9 oscillators print positive divergence with price action.
4) Falling wedge forecasts 2000% move to 70 cents.
Is it possible price action continues correcting? Sure.
Is it probable? No.
Ww

ZEREBRO - an undercover story! As we speak, new narratives are coming out, new partnerships are created boost the crypto projects. This coin is a clear example of that.
Zerebro is an autonomous AI system crafted to create, distribute, and analyze content across decentralized and social platforms.
This is quite cool, seen the overall crypto momentum, and market structure of this coin.
Breaking the .70$ price barrier with increasing volumes, this coin is going towards our first possible potential target around 1.4.. but this isn't all ..
stay tuned
good trading and for now happy new year ;-)


The Critical Rebound: Is ZEREBROUSD Ready for Its Next Big Move?Navigating the Rebound Zone: A Make-or-Break Moment for ZEREBROUSDT.P
ZEREBROUSDT.P has captured the spotlight as it hovers near its recent lows at $0.1166, marking a mere 3.08% deviation from this critical support level. With the price currently at $0.1202, the asset has retraced a staggering 84.97% from its absolute high of $0.8 earlier this month. These numbers signal an oversold condition, further reinforced by the RSI at 27.18, deeply entrenched in bearish territory.
The question arises: Is the market poised for a bullish reversal or further decline? Recent patterns suggest a tug-of-war. The "Increased Buy Volumes" pattern hints at growing demand, but the low MFI of 26.38 shows liquidity concerns are still holding back momentum.
Meanwhile, macroeconomic factors like subdued liquidity flows and ongoing market corrections across broader crypto assets are critical to watch. For traders and investors alike, this is not just another moment—it’s the moment to decide. Will ZEREBROUSDT.P hold its line and spark a rally? Or is the support too fragile, leading to a new bottom?
Brace yourselves—today's technical signals and market narratives may chart the path ahead. If you’re seeking an edge, the time to act is now.
Roadmap: Tracing the Journey of ZEREBROUSDT.P Patterns
Here’s the roadmap of ZEREBROUSDT.P’s recent market patterns—a timeline of events that confirms how well the trends held up and where they faltered. Buckle up as we trace the pivotal moments and assess their impact!
2025-01-22, 22:00 UTC: VSA Buy Pattern Extra 2nd
This pattern signaled a Buy direction with a setup for a major upward swing. However, the follow-up movement did not confirm the prediction. Price closed at $0.1834, but subsequent sell pressure suggests the trigger point failed to hold. This pattern, while textbook, missed its chance to deliver.
2025-01-24, 20:00 UTC: VSA Buy Pattern Extra 1st
A low at $0.1353 and a close at $0.1365 indicated potential bullish momentum. This time, the main direction aligned as prices pushed higher in the next bars, validating the predicted Buy signal. Traders catching this move could have enjoyed a steady climb.
2025-01-25, 00:00 UTC: Sell Volumes
This pattern hinted at Sell pressure. Price indeed dropped from $0.1277 to a close of $0.1178, solidifying the bearish sentiment. It was a textbook confirmation of the downward trend.
2025-01-25, 01:00 UTC: Buy Volumes
Finally, a glimpse of bullish resurgence. The price rebounded from $0.1167 to close at $0.1216, marking a solid recovery. The alignment with the Buy direction showed a reliable follow-through, confirming trader confidence.
Takeaway for Traders :
Patterns that align their direction with subsequent movements are the goldmine for traders. This roadmap shows how ZEREBROUSDT.P offered moments of clarity amid market noise. Keep your eyes sharp for those key validations—when patterns hit, they hit big!
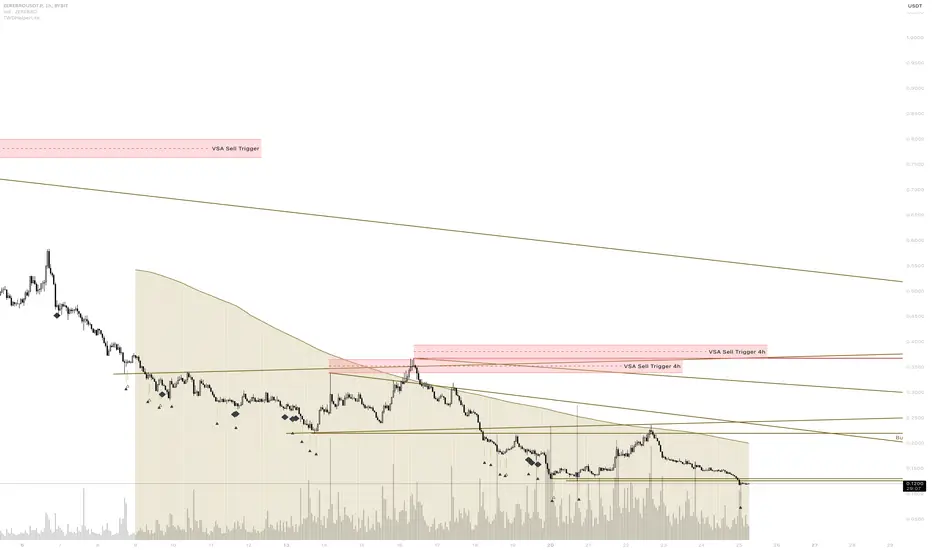
Technical & Price Action Analysis: Key Support and Resistance Levels
Here’s the rundown of the hot zones where price action has been playing its game. Traders, these levels are your go-to for decision-making—whether to jump in or step back. Remember, if these levels don’t hold, they’re likely to flip and act as resistance. Let’s dive in!
Support Levels:
The market is testing support zones with precision, but nothing is etched in stone here. Eyes are on these levels to hold or flip.
Resistance Levels:
Resistance is where the sellers show their teeth. Watch how price reacts to these caps:
0.1312 – The first wall. Break this, and you’re in the game.
0.256 – A mid-level hurdle; momentum traders will love a clean breakout here.
0.3535 – Major resistance. If bulls smash through, this could pave the way for explosive moves.
0.3791 – A level not to ignore. It’s where the action could get intense.
0.4082 – The ultimate test. Conquer this, and the sky’s the limit.
Powerful Support Levels:
No notable “brick walls” of support have shown up just yet. Keep an eye out for developments.
Powerful Resistance Levels:
Still waiting for big players to draw the line here, but don’t take your eyes off the existing resistance points.
Pro Tip for Traders :
If these levels crack, don’t panic. Instead, watch for flips—they’ll become your new resistance zones, giving you a roadmap for the next move. Stay sharp and trade smart!
Trading Strategies Based on Rays: Dynamic Fibonacci-Level Trading Concept
The "Rays from the Beginning of Movement" concept uses Fibonacci-based dynamic levels to map price action with precision. Rays act as guides, marking zones of potential reversals or continuations, while intersections with Moving Averages (MAs) and Volume Spread Analysis (VSA) patterns provide further confirmation.
Core Idea :
Rays are derived from the origin of a trend or corrective movement. They define dynamic support and resistance channels, allowing traders to identify opportunities as price interacts with these levels. The strategy focuses on probability, not certainty, providing adaptable scenarios to traders.
Optimistic Scenario :
Price continues its upward trajectory after successfully interacting with key rays and dynamic supports like the Moving Averages. Targets align with resistance levels and Fibonacci-based zones.
Pessimistic Scenario :
Price breaks downward through dynamic supports, triggering a move to test lower rays and Fibonacci-calculated levels. This sets up potential short trades with clearly defined risk-reward zones.
Trade Scenarios and Levels
Each trade begins upon price interaction with a ray and confirmation of direction. Targets progress ray-to-ray, ensuring systematic profit-taking opportunities.
Trade 1: Long from $0.1202
First Target: $0.1312 – Initial breakout through resistance and interaction with an ascending ray.
Second Target: $0.256 – Continuation along the dynamic channel, reflecting bullish sentiment.
Trade 2: Short from $0.1202
First Target: $0.1166 – Testing the absolute low.
Second Target: $0.1100 – Further decline beyond the ray intersection, signaling bearish momentum.
Trade 3: Long from $0.1166
First Target: $0.1202 – Recovery after dynamic interaction with the ray.
Second Target: $0.1312 – Continuation of bullish movement.
Trade 4: Short from $0.1312
First Target: $0.1202 – Reversal after rejection at this key resistance ray.
Second Target: $0.1166 – Retesting the lower dynamic boundary.
Key Takeaways :
Wait for price interaction with rays and dynamic indicators like MAs and VSA patterns.
Enter positions only after a clear direction is established, and ride the move from one ray to the next.
Dynamic adjustments ensure adaptability, and each ray serves as the next logical target in either bullish or bearish scenarios.
Stay disciplined and let the rays guide your trades from one level to the next. Success lies in patience and precision!
Your Move: Let’s Keep the Conversation Going!
Got questions or thoughts about this analysis? Drop them straight into the comments below—I’m here to chat, clarify, and brainstorm with you. Let’s make trading smarter together!
If you’ve found this roadmap useful, don’t forget to hit that Boost button and save this idea to track how price moves according to my setup. Seeing how levels play out is one of the best ways to sharpen your trading edge.
Curious about the tools behind this analysis? My proprietary indicator automatically maps these rays and levels, making it easier to pinpoint trades. It’s currently private, but feel free to reach out via direct message if you’re interested in accessing it.
I’m also happy to craft analyses for any asset you’re following. Whether it’s something you want to keep private or share with the community, let’s discuss your needs. Just comment your asset and any preferences, and I’ll do my best to deliver.
Remember, these rays work on all assets, and price action respects them beautifully. If there’s a specific chart you’d like mapped out, Boost this post and let me know in the comments—I’ll add it to my list!
Finally, don’t miss out—follow me here on TradingView to stay updated on my latest ideas. Let’s grow together and make trading not just profitable, but enjoyable! 🚀
ZEREBRO - Bullish Divergence Buy signal Trigger15m Chart
Price making lower lows - Momentum indicators making higher highs.
Bullish divergence, Buy signal triggers on break above 0.19

ZEREBROas we can see zerebro broke the downtrend line, rn it is doing an accumulation and very soon i can expect from it to do a huge reversal long spike, 1-2x
I am really curious to see how the market will perform during the weekend and also i will keep an eye on Zerebro, id love to see bulls to return the big green dildo for it..
nfa
dyor

zerebrousdtMEXC:ZEREBROUSDT chart pattern predicting a next target of $0.58 is interesting. However, according to the current market data, the price of MEXC:ZEREBROUSDT is $0.35.

Zerebro Bottom? Almost 8 daily candles in the red.
All liquidity has been cleared.
We’re now in the zone of key volumes.
There’s a high chance the price will start reversing here if Bitcoin holds 90K.
The first target is nearly 100% growth.
#deviles
#deviles secret book

ZEREBRO what a decline for zerebro, but i think this is a great opportunity for price jump.
i have marked the lower price for reaction and honestly i do not think that the correction will go lower than the marked price, but who knows, what i am pretty sure, this thing will do a big green dildo...
time to see what happens..
do not trade till you are pretty sure what is happening.

Very important for ZerebroI think it can start growing again after reaching X-point 💰
🔴 attention: This is a personal opinion and it may be violated.

ZEREBROtrying to figure out, if this token will go long now, after the rejection that got after being in Binance futures..
waiting 1 hour more to get confirmation if goes long
