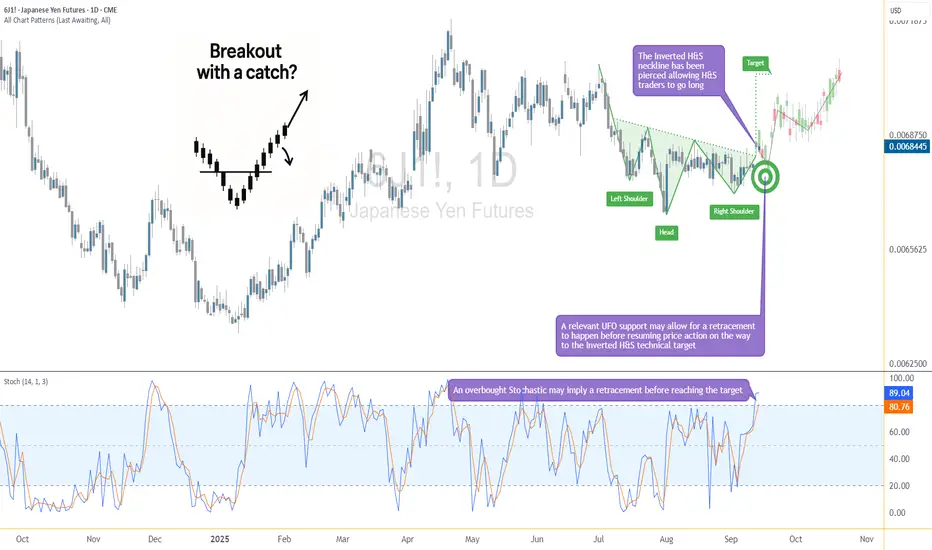
The Japanese Yen Futures (6J) have just pierced above a critical neckline at 0.0068220, completing an Inverted Head and Shoulders formation. This classical reversal pattern often signals a potential shift in momentum from bearish to bullish. Based on technical projections, the measured move points toward a target near 0.0070430, which lies significantly higher from current price levels.
Yet, there’s a catch. The Stochastic Oscillator has entered overbought territory, hinting that before the next upward leg develops, a retracement could occur. This makes the current setup particularly interesting, as the neckline breakout is bullish, but timing entries becomes crucial to avoid getting caught in a short-term dip.
Understanding the Inverted Head & Shoulders
The Inverted Head and Shoulders is one of the most recognized reversal patterns in technical analysis. It typically forms after a prolonged decline and suggests that bearish momentum is losing steam.
The structure consists of three parts:
Once price pierces above the neckline, the pattern is considered complete. Traders often project the distance from the head to the neckline and extend it upward to identify a potential price objective. In this case, the neckline break projects a target near 0.0070430.
The reliability of this formation lies in its ability to signal a shift in trend sentiment. While no pattern is flawless, the inverted H&S is widely respected for its potential consistency.
The Role of Stochastic in This Setup
While the breakout above the neckline looks promising, momentum indicators suggest caution. The Stochastic Oscillator, a tool designed to measure overbought and oversold conditions, is currently flashing an overbought reading.
This does not necessarily mean that prices must reverse, but it does imply that the bullish move could pause or correct before resuming. In practical terms, traders might expect a short-term retracement as buying pressure temporarily exhausts itself.
Such pullbacks can be constructive within a broader bullish setup, especially if they occur near significant areas of support. By aligning the breakout pattern with Stochastic signals, traders can time their entries with more precision instead of chasing the market at stretched levels.
Support Zone & Safety Net
One of the strongest features of this setup is the presence of a relevant support area just below the neckline breakout level. This zone, also reinforced by a previously identified UFO support, could serve as a launching pad if prices retrace lower in the short term.
If 6J dips back toward the neckline, traders will be watching whether this level holds. A bounce from here would not only validate the breakout but also offer an attractive risk-to-reward setup. To manage downside exposure, a protective stop can be placed at 0.0067350, positioned below this key support zone.
This structure creates a layered safety net: first the neckline, then the underlying support, and finally the stop loss—offering multiple defenses against unfavorable moves before the bullish scenario invalidates.
Contract Specs & Margins (6J & MJY)
CME offers both the standard Japanese Yen Futures (6J) and the smaller-sized Micro JPY/USD Futures (MJY), giving traders flexibility depending on capital requirements and position sizing needs.
🟢 6J – Japanese Yen Futures
🟢 MJY – Micro JPY/USD Futures
The Micro contracts replicate the price behavior of the standard Yen futures at a fraction of the size. This makes them attractive for traders who want to fine-tune risk exposure, scale in or out more precisely, or manage positions with smaller capital outlays.
Trade Plan Example
A structured trade idea can help frame the opportunity while managing risk effectively:
Reward-to-Risk Calculation:
This ratio is favorable, suggesting that the upside potential outweighs the defined downside exposure. Traders considering this setup may prefer to wait for a retracement toward support, which could enhance entry quality and improve the reward-to-risk profile even further.
The Importance of Risk Management
Even the most compelling technical setups require disciplined risk management. Using stop-loss orders is essential to protect capital against unexpected market swings, particularly in leveraged products like futures.
Position sizing is another key element—adjusting contract size to account size ensures that a single trade does not overexpose the portfolio. Micro contracts, such as MJY, are especially useful for traders looking to scale positions with precision.
Equally important is the principle of avoiding undefined risk. Every trade should have a clearly defined exit strategy, both for profits and losses. By knowing where to enter, where to exit, and where to cut losses, traders reduce emotional decision-making and maintain consistency.
Finally, patience plays a role. Waiting for a retracement into support rather than chasing a stretched market often improves entry quality, lowers risk, and increases the probability of success.
Conclusion
Japanese Yen Futures are showing signs of a potential trend shift as the inverted head and shoulders formation breaks above its neckline. The measured move points toward higher ground, but the overbought Stochastic warns that the path may not be in a straight line. A temporary dip into support could provide a second chance for bulls to position themselves with a favorable risk-to-reward profile.
By combining pattern recognition, momentum analysis, and precise trade planning, this setup highlights how technical structure and disciplined execution can align to create opportunity. Whether trading the standard 6J contract or the smaller MJY, the key remains the same: respect risk, trust the setup, and let the market confirm the move.
When charting futures, the data provided could be delayed. Traders working with the ticker symbols discussed in this idea may prefer to use CME Group real-time data plan on TradingView: tradingview.com/cme/ - This consideration is particularly important for shorter-term traders, whereas it may be less critical for those focused on longer-term trading strategies.
General Disclaimer:
The trade ideas presented herein are solely for illustrative purposes forming a part of a case study intended to demonstrate key principles in risk management within the context of the specific market scenarios discussed. These ideas are not to be interpreted as investment recommendations or financial advice. They do not endorse or promote any specific trading strategies, financial products, or services. The information provided is based on data believed to be reliable; however, its accuracy or completeness cannot be guaranteed. Trading in financial markets involves risks, including the potential loss of principal. Each individual should conduct their own research and consult with professional financial advisors before making any investment decisions. The author or publisher of this content bears no responsibility for any actions taken based on the information provided or for any resultant financial or other losses.
Yet, there’s a catch. The Stochastic Oscillator has entered overbought territory, hinting that before the next upward leg develops, a retracement could occur. This makes the current setup particularly interesting, as the neckline breakout is bullish, but timing entries becomes crucial to avoid getting caught in a short-term dip.
Understanding the Inverted Head & Shoulders
The Inverted Head and Shoulders is one of the most recognized reversal patterns in technical analysis. It typically forms after a prolonged decline and suggests that bearish momentum is losing steam.
The structure consists of three parts:
- Left Shoulder: the first swing low, followed by a rebound
- Head: a deeper low, which marks the exhaustion of sellers
- Right Shoulder: a higher low, indicating buyers are stepping in earlier
- Neckline: the resistance level connecting the highs of the shoulders, acting as the trigger point
Once price pierces above the neckline, the pattern is considered complete. Traders often project the distance from the head to the neckline and extend it upward to identify a potential price objective. In this case, the neckline break projects a target near 0.0070430.
The reliability of this formation lies in its ability to signal a shift in trend sentiment. While no pattern is flawless, the inverted H&S is widely respected for its potential consistency.
The Role of Stochastic in This Setup
While the breakout above the neckline looks promising, momentum indicators suggest caution. The Stochastic Oscillator, a tool designed to measure overbought and oversold conditions, is currently flashing an overbought reading.
This does not necessarily mean that prices must reverse, but it does imply that the bullish move could pause or correct before resuming. In practical terms, traders might expect a short-term retracement as buying pressure temporarily exhausts itself.
Such pullbacks can be constructive within a broader bullish setup, especially if they occur near significant areas of support. By aligning the breakout pattern with Stochastic signals, traders can time their entries with more precision instead of chasing the market at stretched levels.
Support Zone & Safety Net
One of the strongest features of this setup is the presence of a relevant support area just below the neckline breakout level. This zone, also reinforced by a previously identified UFO support, could serve as a launching pad if prices retrace lower in the short term.
If 6J dips back toward the neckline, traders will be watching whether this level holds. A bounce from here would not only validate the breakout but also offer an attractive risk-to-reward setup. To manage downside exposure, a protective stop can be placed at 0.0067350, positioned below this key support zone.
This structure creates a layered safety net: first the neckline, then the underlying support, and finally the stop loss—offering multiple defenses against unfavorable moves before the bullish scenario invalidates.
Contract Specs & Margins (6J & MJY)
CME offers both the standard Japanese Yen Futures (6J) and the smaller-sized Micro JPY/USD Futures (MJY), giving traders flexibility depending on capital requirements and position sizing needs.
🟢 6J – Japanese Yen Futures
- Contract size: ¥12,500,000
- Minimum tick: 0.0000005 = $6.25
- Initial margin: ≈ $3,100 (subject to CME updates)
🟢 MJY – Micro JPY/USD Futures
- Contract size: ¥1,250,000 (1/10th of standard)
- Minimum tick: 0.000001 = $1.25
- Initial margin: ≈ $310 (subject to CME updates)
The Micro contracts replicate the price behavior of the standard Yen futures at a fraction of the size. This makes them attractive for traders who want to fine-tune risk exposure, scale in or out more precisely, or manage positions with smaller capital outlays.
Trade Plan Example
A structured trade idea can help frame the opportunity while managing risk effectively:
- Direction: Long
- Entry: Near 0.0068220 (neckline breakout level), or after a retracement toward support
- Stop: 0.0067350 (below the support zone)
- Target: 0.0070430 (measured objective from the inverted H&S)
Reward-to-Risk Calculation:
- Potential reward = 0.0070430 – 0.0068220 = 0.0002210
- Potential risk = 0.0068220 – 0.0067350 = 0.0000870
- Approximate ratio = 2.5 : 1
This ratio is favorable, suggesting that the upside potential outweighs the defined downside exposure. Traders considering this setup may prefer to wait for a retracement toward support, which could enhance entry quality and improve the reward-to-risk profile even further.
The Importance of Risk Management
Even the most compelling technical setups require disciplined risk management. Using stop-loss orders is essential to protect capital against unexpected market swings, particularly in leveraged products like futures.
Position sizing is another key element—adjusting contract size to account size ensures that a single trade does not overexpose the portfolio. Micro contracts, such as MJY, are especially useful for traders looking to scale positions with precision.
Equally important is the principle of avoiding undefined risk. Every trade should have a clearly defined exit strategy, both for profits and losses. By knowing where to enter, where to exit, and where to cut losses, traders reduce emotional decision-making and maintain consistency.
Finally, patience plays a role. Waiting for a retracement into support rather than chasing a stretched market often improves entry quality, lowers risk, and increases the probability of success.
Conclusion
Japanese Yen Futures are showing signs of a potential trend shift as the inverted head and shoulders formation breaks above its neckline. The measured move points toward higher ground, but the overbought Stochastic warns that the path may not be in a straight line. A temporary dip into support could provide a second chance for bulls to position themselves with a favorable risk-to-reward profile.
By combining pattern recognition, momentum analysis, and precise trade planning, this setup highlights how technical structure and disciplined execution can align to create opportunity. Whether trading the standard 6J contract or the smaller MJY, the key remains the same: respect risk, trust the setup, and let the market confirm the move.
When charting futures, the data provided could be delayed. Traders working with the ticker symbols discussed in this idea may prefer to use CME Group real-time data plan on TradingView: tradingview.com/cme/ - This consideration is particularly important for shorter-term traders, whereas it may be less critical for those focused on longer-term trading strategies.
General Disclaimer:
The trade ideas presented herein are solely for illustrative purposes forming a part of a case study intended to demonstrate key principles in risk management within the context of the specific market scenarios discussed. These ideas are not to be interpreted as investment recommendations or financial advice. They do not endorse or promote any specific trading strategies, financial products, or services. The information provided is based on data believed to be reliable; however, its accuracy or completeness cannot be guaranteed. Trading in financial markets involves risks, including the potential loss of principal. Each individual should conduct their own research and consult with professional financial advisors before making any investment decisions. The author or publisher of this content bears no responsibility for any actions taken based on the information provided or for any resultant financial or other losses.
🌟 Take This Analysis Further with Our AI Scripts 🎯 | Discover How at tradewithufos.com 🚀 Choose a Subscription: Monthly ᴼᴿ Yearly ᴼᴿ Lifetime 🗓️ | Unlock Intelligent UFO Scripts Free 💡
Related publications
Disclaimer
The information and publications are not meant to be, and do not constitute, financial, investment, trading, or other types of advice or recommendations supplied or endorsed by TradingView. Read more in the Terms of Use.