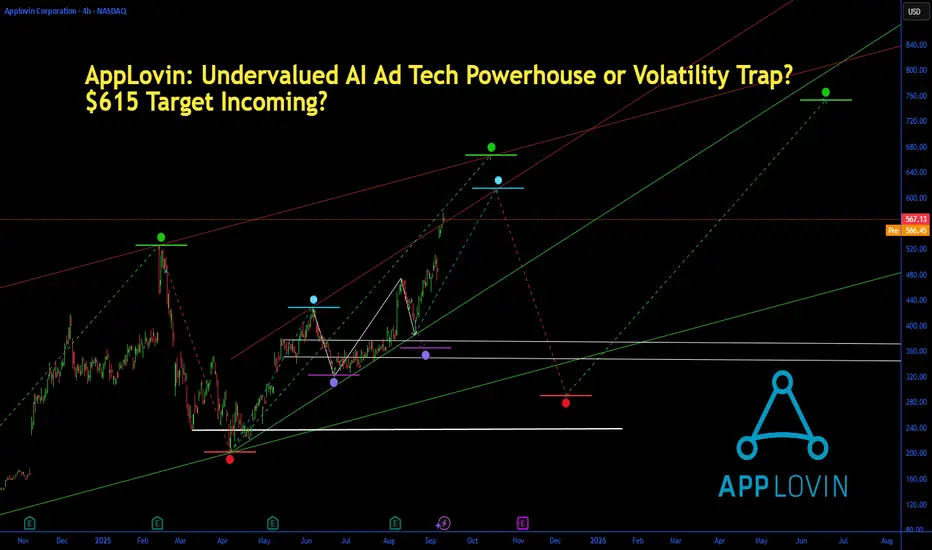
AppLovin: Undervalued AI Ad Tech Powerhouse or Volatility Trap? $615 Target Incoming?
AppLovin (APP) shares are trading at $567.12 today, up 1.60% amid a fresh 52-week high and S&P 500 inclusion set for September 22, fueling a 75% YTD rally driven by its AI-powered marketing platform.
With Q2 2025 earnings crushing expectations—revenue surging 44% YoY to $1.44B and EPS at $0.89—analysts are bullish, hiking targets to $615 amid 53% projected EPS growth over 3-5 years. But at a trailing P/E of 78x, is APP the undervalued gem poised to go viral in the $500B mobile ad market, or will high beta (3.85) and market jitters trigger a pullback? Let's unpack the fundamentals, SWOT, charts, and setups for September 11, 2025.
Fundamental Analysis
AppLovin's dominance in mobile app advertising and gaming, bolstered by its AXON AI engine, has propelled explosive growth, with free cash flow hitting $1.2B TTM and margins expanding to 35%. Analysts forecast 2025 EPS of $13.49 on $5.74B revenue, up 40% YoY, as AI optimizations drive advertiser ROI in a post-cookie world. Recent S&P 500 addition could attract $10B+ in passive inflows, underscoring its undervalued status at 1.8% below fair value per DCF models. However, premium valuations reflect growth bets, with risks from ad spending slowdowns if the economy softens.
- **Positive:**
- AI platform fueling 53% EPS growth forecast; Q2 beat with 44% revenue jump and net income flipping to $236M from prior losses.
- S&P 500 entry sparks institutional demand; market cap at $191.8B undervalues its 700%+ stock surge since 2023 lows.
- Broader trends in digital ads and gaming (e.g., partnerships with Unity) position APP for 20%+ annual gains amid AI boom.
- **Negative:**
- High beta (3.85) amplifies volatility; recent 24% monthly gain risks overextension if Fed delays cuts.
- Competition from Meta and Google could pressure market share if ad budgets shift.
SWOT Analysis
**Strengths:** Leading AI-driven ad tech with 2B+ daily users; strong cash generation ($1.2B FCF) enables buybacks and acquisitions; proven turnaround from gaming to profitable software focus.
**Weaknesses:** Elevated P/E (78x TTM) signals growth dependency; high volatility with beta 3.85 exposes to market swings; reliance on mobile ecosystem vulnerable to app store policy changes.
**Opportunities:** S&P 500 inclusion for passive inflows; expansion into e-commerce and CTV ads via AI; undervalued growth at 42x forward P/E amid 53% EPS CAGR.
**Threats:** Economic downturn crimping ad spend; intensifying competition from Big Tech; regulatory scrutiny on data privacy impacting AI models.
Technical Analysis
On the daily chart, APP is in a strong uptrend, breaking to new 52-week highs at $576 after consolidating above $500 support, with volume spiking on S&P news. The weekly shows a multi-year bull flag breakout from 2023 lows, now extending with higher highs. Current price: $567.12, with VWAP near $560 as intraday pivot.
Key indicators:
- **RSI (14-day):** At 68, bullish but approaching overbought—room for extension if momentum holds. 📈
- **MACD:** Positive crossover with expanding histogram, confirming upside acceleration; watch for divergence on overbought signals. ⚠️
- **Moving Averages:** Price well above 21-day EMA ($520) and 50-day SMA ($480), with golden cross intact; 200-day EMA at $350 trails far below.
Support/Resistance: Key support at $500 (recent breakout level and 50-day SMA), resistance at $576 (all-time high) and $615 (analyst target). Patterns/Momentum: Bull flag extension targets $650; strong buy rating for 1-week horizon. 🟢 Bullish signals: Volume surge and S&P catalyst. 🔴 Bearish risks: Overbought RSI could prompt 10% pullback on profit-taking.
Scenarios and Risk Management
- **Bullish Scenario:** Break above $576 on S&P inflows or soft CPI data targets $615 short-term, then $650 by year-end. Buy pullbacks to $500 for high-conviction entries.
- **Bearish Scenario:** Drop below $500 eyes $450 (200-day EMA); broader tech selloff could retrace 15-20% if growth slows.
- **Neutral/Goldilocks:** Range-bound $500–$576 if data mixed, ideal for options plays or waiting for Q3 earnings.
Risk Tips: Set stops 3% below support ($485) to manage volatility. Risk 1-2% per trade. Diversify with META or GOOGL to hedge ad sector correlations—avoid overexposure in high-beta names.
Conclusion/Outlook
Overall, a bullish bias if APP sustains above $500, highlighting its undervalued growth with 50%+ upside amid AI ad dominance and S&P buzz—perfect for viral momentum in retail circles. But monitor Fed decisions and Q3 guidance for confirmation; this fits September's small-cap rotation into high-growth tech. What’s your take? Loading up on APP's rally or waiting for a dip? Share in the comments!
Note
Why the Debt Isn't a DealbreakerStrong Cash Generation Covers It Easily: AppLovin threw off $768 million in Free Cash Flow (FCF) just in Q2 2025 , with $1.59 billion in the first half of the year
. Annualized, that's over $3 billion in FCF—enough to pay down the entire debt in about a year if they prioritized it over growth or buybacks. Interest expense was only $51 million for the quarter
, giving an EBITDA interest coverage ratio of ~20x (based on $1.018 billion Adjusted EBITDA)
. That's rock-solid—way above the 1.5x-2x threshold where debt starts getting risky.
What They're Doing With It: The debt (mostly senior unsecured notes) funds aggressive share buybacks and acquisitions, which have fueled the stock's 75% YTD run. They repurchased $1.3 billion in shares in H1 2025 alone
, reducing shares outstanding to 339 million and boosting EPS. Plus, they have $994 million available on their credit facility with no borrowings outstanding
, and cash reserves at $1.19 billion
. Net debt (debt minus cash) is only ~$2.3 billion, far from crippling.
Growth Justifies the Leverage: At a forward P/E of 42x (with 53% projected EPS growth), the market prices in hyper-growth from their AI ad platform. Q2 revenue hit $1.26 billion (up 77% YoY), net income $820 million (up 164%), and EBITDA margins at 81%
. For comparison, peers like Meta or Unity carry similar or higher leverage during growth phases, but AppLovin's FCF yield (1.6% on market cap) supports the "undervalued" tag if you believe in 40%+ annual revenue CAGR.
Updated Valuation TakeFactoring in the debt, enterprise value is $194 billion (market cap $192B + net debt). On annualized EBITDA ($4B), that's an EV/EBITDA of ~48x—premium, but undervalued relative to growth peers if AI ads keep exploding. Analysts' $615 target still implies 8% upside from $567, but viral potential (S&P inclusion, AI hype) could push it higher.If debt worries you, watch Q3 earnings for more buybacks or deleveraging. Debt's a tool here, not a trap—still bullish overall. Thoughts?
⚡️ Request a trial or subscribe to our premium🛠️tools at ➡️DCAlpha.net
All scripts & content provided by DCAChampion are for informational & educational purposes only.
All scripts & content provided by DCAChampion are for informational & educational purposes only.
Disclaimer
The information and publications are not meant to be, and do not constitute, financial, investment, trading, or other types of advice or recommendations supplied or endorsed by TradingView. Read more in the Terms of Use.