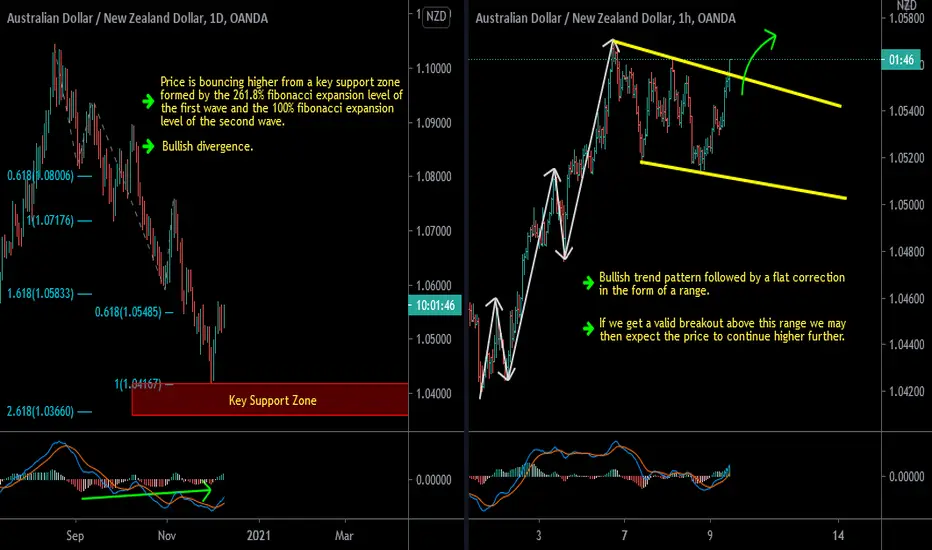
D1 - Price is bouncing higher from a key support zone formed by the 261.8% fibonacci expansion level of the first wave and the 100% fibonacci expansion level of the second wave.
Bullish divergence.
H1 - Bullish trend pattern followed by a flat correction in the form of a range.
If we get a valid breakout above this range we may then expect the price to continue higher further.
Bullish divergence.
H1 - Bullish trend pattern followed by a flat correction in the form of a range.
If we get a valid breakout above this range we may then expect the price to continue higher further.
Note
A valid breakout above the range happened as expected and the price moved higher further providing an amazing move to the upside!Disclaimer
The information and publications are not meant to be, and do not constitute, financial, investment, trading, or other types of advice or recommendations supplied or endorsed by TradingView. Read more in the Terms of Use.
Disclaimer
The information and publications are not meant to be, and do not constitute, financial, investment, trading, or other types of advice or recommendations supplied or endorsed by TradingView. Read more in the Terms of Use.