🔍 Key Levels
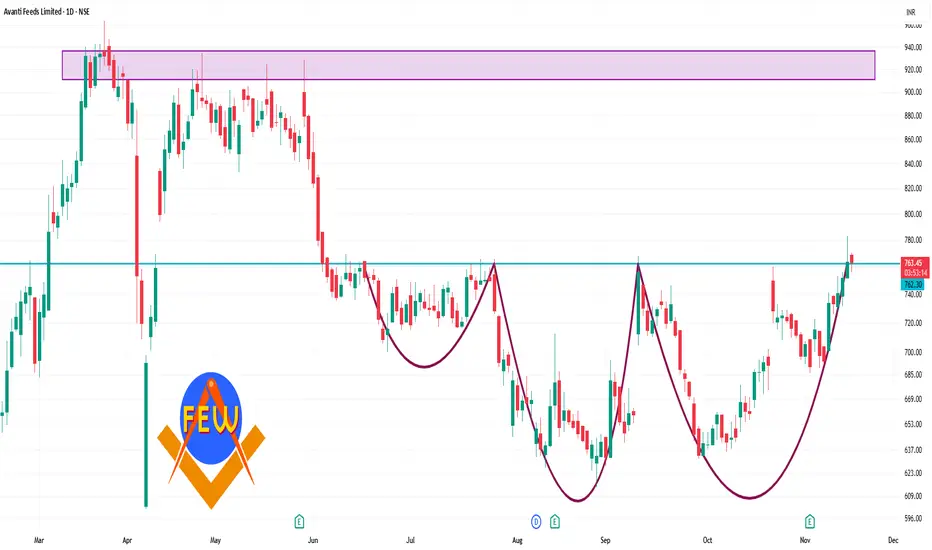
Pivot (Daily): ~ ₹ 746.47
Resistance levels:
R1 ~ ₹ 761.48
R2 ~ ₹ 770.92
R3 ~ ₹ 785.93
Support levels:
S1 ~ ₹ 737.03
S2 ~ ₹ 722.02
S3 ~ ₹ 712.58
✅ Interpretation & Use
If price holds above ~₹ 746.47 and shows strength, the next meaningful resistance zone is ~ ₹ 761-771.
If price drops below the pivot, then supports around ~ ₹ 737, and further down ~ ₹ 722 or ~ ₹ 712 become relevant.
The momentum indicators (RSI ~67.6, MACD positive) suggest bullish bias but note: when RSI gets high → risk of pull-back increases.
Related publications
Disclaimer
The information and publications are not meant to be, and do not constitute, financial, investment, trading, or other types of advice or recommendations supplied or endorsed by TradingView. Read more in the Terms of Use.
Related publications
Disclaimer
The information and publications are not meant to be, and do not constitute, financial, investment, trading, or other types of advice or recommendations supplied or endorsed by TradingView. Read more in the Terms of Use.