Observe the synergy of multiple time frames with this detailed analysis of Bhageria Industries Ltd.
Target Points -
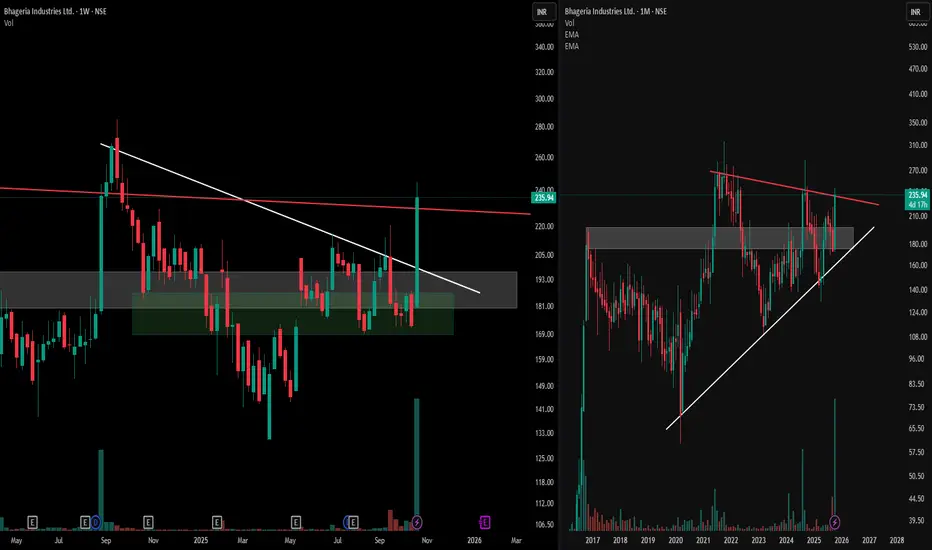
1) The right panel displays a monthly chart, highlighting a broad symmetrical triangle formation within a prominent supply-demand zone—notice how the structure showcases the interplay of lower highs and higher lows, reflecting a period of equilibrium and market compression.
2) The left panel brings the focus to the weekly time frame, where a descending triangle pattern unfolds, providing additional insight into the ongoing price structure.
3) This multi-time frame approach emphasizes how patterns from broader time frames interact with shorter-term consolidations, enhancing our ability to spot critical decision areas on the charts.
4) Using both the monthly and weekly perspectives together, traders and learners can deepen their understanding of structural price action, pattern development, and the relevance of context provided by supply and demand zones. Dissecting these formations side by side promotes disciplined, informed chart reading without bias towards anticipating outcomes.
This analysis is for educational purposes only and does not constitute financial advice.
Target Points -
1) The right panel displays a monthly chart, highlighting a broad symmetrical triangle formation within a prominent supply-demand zone—notice how the structure showcases the interplay of lower highs and higher lows, reflecting a period of equilibrium and market compression.
2) The left panel brings the focus to the weekly time frame, where a descending triangle pattern unfolds, providing additional insight into the ongoing price structure.
3) This multi-time frame approach emphasizes how patterns from broader time frames interact with shorter-term consolidations, enhancing our ability to spot critical decision areas on the charts.
4) Using both the monthly and weekly perspectives together, traders and learners can deepen their understanding of structural price action, pattern development, and the relevance of context provided by supply and demand zones. Dissecting these formations side by side promotes disciplined, informed chart reading without bias towards anticipating outcomes.
This analysis is for educational purposes only and does not constitute financial advice.
🎯 Master My Self-Made Trading Strategy
📈 Telegram (Learn Today): t.me/hashtaghammer
✅ WhatsApp (Learn Today): wa.me/919455664601
📈 Telegram (Learn Today): t.me/hashtaghammer
✅ WhatsApp (Learn Today): wa.me/919455664601
Related publications
Disclaimer
The information and publications are not meant to be, and do not constitute, financial, investment, trading, or other types of advice or recommendations supplied or endorsed by TradingView. Read more in the Terms of Use.