1. Structure After the Blowoff Top
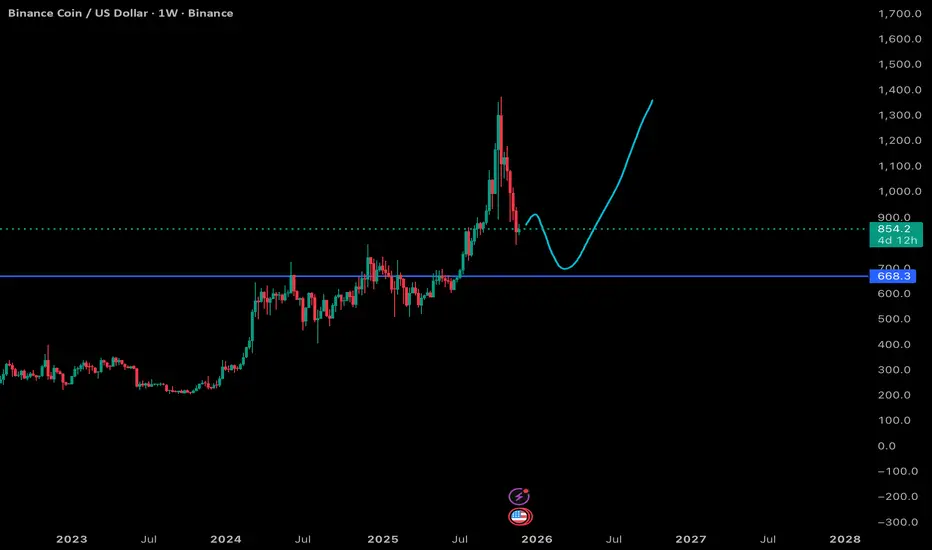
BNB has clearly broken its parabolic structure. The rejection wick near the 1500 zone and the sustained multi-week sell pressure indicate the trend has shifted into corrective mode. Momentum has cooled, and candles are now printing lower highs and lower lows on the weekly timeframe.
The key technical zones are:
- Dotted line around ~900 - former breakout region that has now flipped into potential resistance.
- Blue zone at ~665-670 - major multi-year support that previously acted as a long accumulation ceiling before the breakout. This is the logical place for a deeper corrective sweep.
- The teal path is consistent with how large caps often correct after vertical expansions.
2. Short Term Outlook: Expect Further Pullback
BNB is holding above 850 for now, but structure suggests it is not done correcting. Signals:
- Weekly momentum turning down without bullish divergence.
- Lower timeframe bounces lacking volume confirmation.
- The distance between price and the weekly moving averages is still wide, which usually compresses through either time or further downside.
If the broader market stays choppy or if BTC consolidates lower, BNB may continue grinding down toward the 665-700 liquidity zone.
3. Medium Term: The 665-670 Reaccumulation Zone
This is the most important area on the chart and the one reflected in the teal scenario. Reasons this zone matters:
- It was the final breakout base before BNB pushed toward 1500.
- Strong historical volume built here during 2024-2025.
- It represents a clean structural retest on the weekly timeframe.
A flush into this region followed by stabilization would create a constructive environment for a new accumulation range.
Signs of bullish reversal to watch for:
- Long lower wicks into 665.
- Momentum flattening on weekly MACD and RSI.
- Reclaim of the 900 level after basing.
4. Longer Term Path: Reclaiming 900 Opens the Trend Back Up
If the market recovers into next year and BNB can reclaim the dotted 900 resistance, the teal path becomes increasingly probable. That would show demand returning, and from there a gradual rebuild toward 1200-1400 is structurally consistent.
BNB tends to lag BTC initially in recovery phases, then accelerate once liquidity rotates into exchange tokens. In strong market conditions, BNB has historically been capable of impulsive catch-up moves.
5. Bearish Scenario
If BNB loses the 665 level on a weekly close:
- Market structure breaks decisively.
- A slide into the 500-550 zone becomes possible.
- It would likely require broader market weakness or exchange-specific risk events.
Not the base case, but important to acknowledge.
Summary
The teal scenario is a reasonable higher-timeframe projection: a deeper dip into the 665 support zone, a multi-month basing structure, and then a recovery if macro conditions improve. The chart suggests the correction is not yet finished, but the larger structure still allows for a bullish continuation in 2025 if BNB holds its critical support and broader market strength returns.
Onchain News is a Crypto research blog.
Tracking BTC, ETH, SOL, ZEC, DeFi projects, onchain flows, and more. 🌐 We also publish UFC / MMA news & opinions. 🥊
DMs open for new projects, follow us on X @OnchainNewsBlog. 📩
Tracking BTC, ETH, SOL, ZEC, DeFi projects, onchain flows, and more. 🌐 We also publish UFC / MMA news & opinions. 🥊
DMs open for new projects, follow us on X @OnchainNewsBlog. 📩
Disclaimer
The information and publications are not meant to be, and do not constitute, financial, investment, trading, or other types of advice or recommendations supplied or endorsed by TradingView. Read more in the Terms of Use.