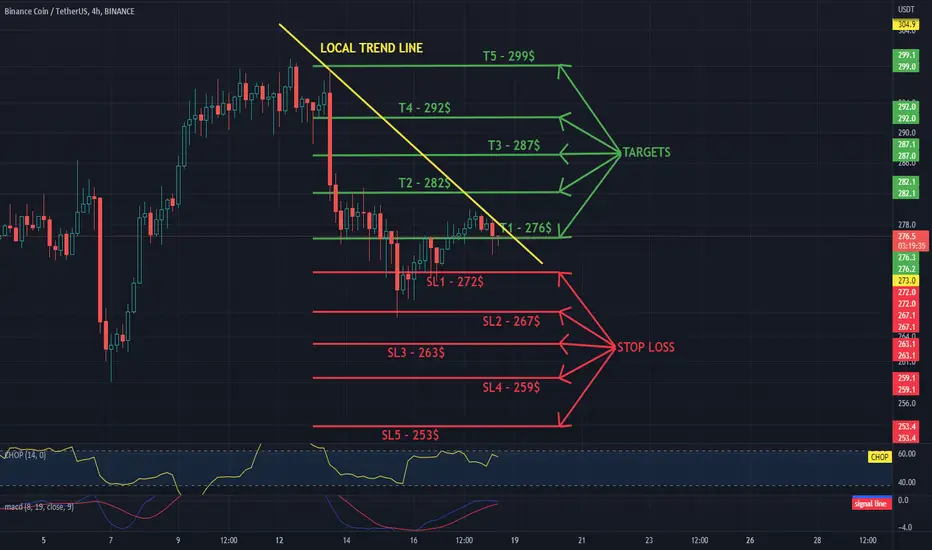
Hello everyone, let's take a look at the 4H BNB to USDT chart as you can see the price is moving below the local downtrend line.
Let's start by setting goals for the near future that we can consider:
T1 - $ 276
T2 - $ 282
T3 - $ 287
T4 - $ 292
and
T5 - $ 299
Now let's move on to the stop loss in case of further market declines:
SL1 - $ 272
SL2 - $ 267
SL3 - $ 263
SL4 - $ 259
and
SL5 - $ 253
Looking at the CHOP indicator, we can see that there is a lot of energy in the 4H range, while the MACD indicator shows the local uptrend.
Disclaimer
The information and publications are not meant to be, and do not constitute, financial, investment, trading, or other types of advice or recommendations supplied or endorsed by TradingView. Read more in the Terms of Use.
Disclaimer
The information and publications are not meant to be, and do not constitute, financial, investment, trading, or other types of advice or recommendations supplied or endorsed by TradingView. Read more in the Terms of Use.