BTC Dominance Weekly Chart Analysis.
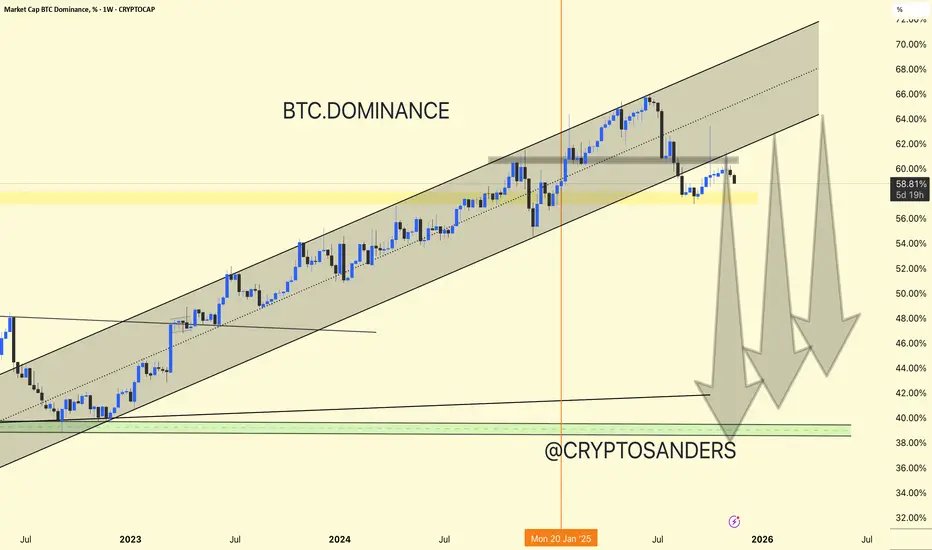
BTC Dominance (% of total crypto market cap) spent most of 2023–2025 in a strong uptrend, forming a rising channel.
Recent Reversal: After peaking above 68%, dominance has broken below the lower channel boundary and is currently retesting previous support-turned-resistance near 60%.
Dominance is hovering above the important yellow horizontal zone (~58%). A sustained move below this could accelerate the downtrend, with further downside targets near the green zone around 40–42%.
Projection: The chart indicates the possibility of a large “altcoin season” ahead (altcoins outperforming BTC) if dominance continues lower. Sharp arrows mark multiple possible legs down, hinting at a prolonged reduction in BTC’s share.
Summary:
BTC.D has broken its major uptrend channel and is now vulnerable. If support at 58% breaks, expect capital rotation into altcoins to intensify, possibly pushing dominance as low as 40% over the coming months
DYOR | NFA
Related publications
Disclaimer
The information and publications are not meant to be, and do not constitute, financial, investment, trading, or other types of advice or recommendations supplied or endorsed by TradingView. Read more in the Terms of Use.
Related publications
Disclaimer
The information and publications are not meant to be, and do not constitute, financial, investment, trading, or other types of advice or recommendations supplied or endorsed by TradingView. Read more in the Terms of Use.