I've identified key price action indications that we have "topped" with an ATH for this Bull Market Cycle. There is a much deeper analysis that needs to be done here.
While this price action is the first major clue, to confirm a true distribution top, we'll also need to analyze volume profiles for institutional selling, spot bearish divergences in key momentum oscillators, and watch on-chain metrics for any signs of whale or miner selling pressure.
Every Bitcoin cycle has a story, and the final chapter is always the most dramatic. I've been analyzing the price action at every major cycle peak, and there's a recurring pattern that acts like a final warning before the curtain falls. It’s not the explosive top itself, but the messy, indecisive period that follows: the Distribution Top.
This isn't just a pattern; it's the visual footprint of a massive transfer of wealth. It’s the moment when the cycle's early investors (smart money) begin to distribute their holdings to the late, euphoric buyers.
Look at the price action from the November 2021 ATH top. After the euphoric peak, the clean, powerful uptrend dies. It's replaced by a volatile, sideways "wiggle." The Heikin Ashi candles lose their bodies, showing long wicks on both sides. This is the signature of market conflict and exhaustion.
Cycle Tops vs. Local Highs: A Crucial Distinction
It's important to understand that this "wiggle" is unique to major, euphoric ATH cycle tops. Other tops, like the one from August 2021 shown below, have a much different character. Notice how the rejection is sharper, faster, and lacks the prolonged, grinding "wiggle." This is often a rejection from a known resistance level, not the slow, painful end of cycle-wide euphoria.
The "Distribution Top" is a process. It’s designed to churn, create confusion, and trap breakout traders before the real move down begins. It’s the market grinding at the highs, absorbing the last wave of FOMO. We saw this exact anatomy play out in the April 2021 top as well.
The Key Takeaway for Bitcoin Investors:
Recognizing this specific pattern is crucial for capital preservation. When you see this shift from clean momentum to choppy, indecisive grinding near an all-time high, it's a signal that the market character has changed. The risk is no longer to the upside; it's to the downside.
While this price action is the first major clue, to confirm a true distribution top, we'll also need to analyze key trend lines, candlestick patterns, seasonality, volume profiles for institutional selling, and watch on-chain metrics for any signs of whale or miner selling pressure.
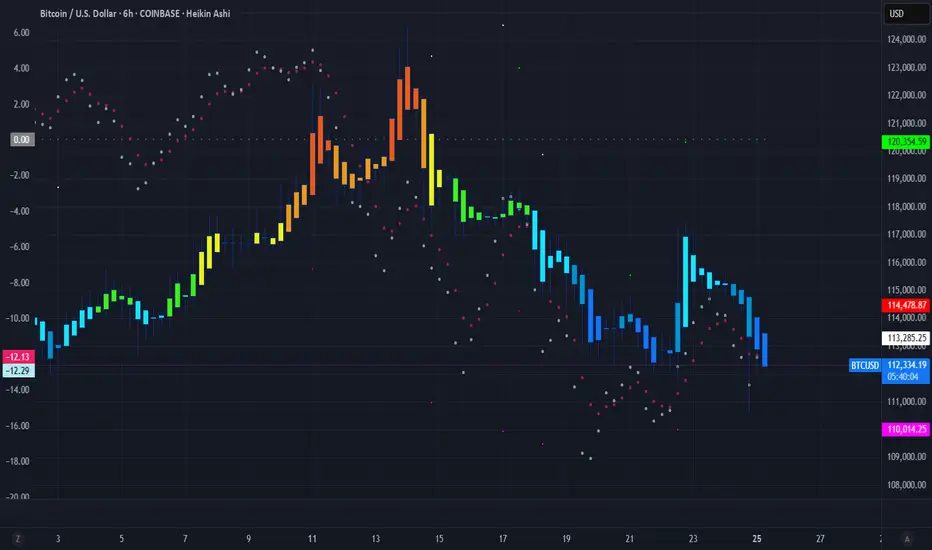
Now, take a look at the most recent price action. We are seeing the early stages of this very same pattern developing after a new high.
The question every Bitcoin holder should be asking is: Is this history rhyming once again?
As I mentioned at the start of this post, there are much more metrics to analyze here, so I'll be updating this post with further findings.
DISCLAIMER
I AM NOT A FINACIAL ADVISOR, NOR AM I YOURS. THIS IS NOT FINANCIAL ADVICE. MEARLY DOODLINGS ON A MATHMATICALLY DRIVEN GRAPHICAL INTERFACE, TRACKING AN INVISIBLE 256BIT MILITARY-GRADE ENCRYPTED ASSET. . . FOR ENTERTAINMENT/AMUSEMENT PUROSES ONLY. ENJOY!
Looking to hear your thoughts on this TradingView Profit_Through_Patience David_Perk ProjectSyndicate Xanrox_ HAMED_AZ melikatrader94
Note
This can be clearly seen in the 3HR and as these things do, is expected to play out in the 6HR, 12HR and ultimately to the Daily. Note
The Wyckoff Method on the Weekly shows an 80% likelihood that the Bull Market Peak was $124K. It looks like we have Sign of Weakness with the next phase (Phase D), being a Markdown Phase. Note
70% - 80%Note
The weekly using the Wyckoff Method of analysis shows that we are reaching a point of "Buying Climax" which is a significant warning sign that represents a point of trend exhaustion where buying from the general public reaches a peak, often signaling the point where smart money begins to sell or distribute their holdings.Note
We're hitting R2 on the Daily as before. I suspect we'll retrace to $107K - $106K before making our move up. We'll need to watch this heave resistance $124K level.
If we make it above on the next few candles then $124K will be the new support.
Note
$126K hit so $124K - $125K should now be resistance. We opened the daily strong above support here at $124K. Next steps are high and this daily is looking very good with large runs up to $138K level next and fast.
Note
"Pi Cycle Top" indicator has not been triggered and I have the sensitivity level dialed in so we'll get an early indication of a Bull Market Top. I still have my eyes on the $150K Top, however we need to proceed with caution as this type of movement is indicative of a dump after a ATH Top.
Note
Retracement Level 1 (R1) at $106K.Note
This is my forecast that I am planning out my trade for. This is that consolidation phase. It's all working out to this December ATH and ultimate top.
Look here. This Pi Top Indicator will trigger after the top event has happened. So far it hasn't happened.
Also look at the Resistance 3 (R3) already at our target of $150K.
Note
So I wasn't accurate this cycle with my forecast, however the math (multiple based on previous highs/lows) is still "highly" looking like it will be accurate at the $150K level. I have this trade in for a wick or body to $102K. however it's a crucial zone, I am expecting this to trade between $117K - $107K range for the next couple months with a climb to the next support tier of $124K - $125K as the support level as we move on to $130K, $138K levels and beyond. (Ultimately reaching our $150K target mid-late December.)
This will mean, and it's already been the longest BTC Cycle in history, we've broken a 16 year 3-4 Cycle pattern. We've got about a 30% chance of hitting a Super-Cycle. We need the right mixture of ingredients for this to happen, however we already have a couple in place which will be increasing our odds and likelihood of a Super-Cycle. I will be writing up a post on this ASAP.
HODLRS have outperformed BTC traders. Keep stackin! We've got a BTC Bear Market Bottom of $33K on the way and a potential Super-Cycle following it or at the least a new ATH next cycle of $300K. BTC is the best performing asset class since it's inception. I would say (personally, aside from things like Quantum Computing Attacks or SHA-256 Encryption flaws that we have a 21,000,000:1 odds, or a 0.00000476% probability that BTC will go to Zero. It would take all players in the game to lose interest and create a zero demand scenario.
Related publications
Disclaimer
The information and publications are not meant to be, and do not constitute, financial, investment, trading, or other types of advice or recommendations supplied or endorsed by TradingView. Read more in the Terms of Use.
Related publications
Disclaimer
The information and publications are not meant to be, and do not constitute, financial, investment, trading, or other types of advice or recommendations supplied or endorsed by TradingView. Read more in the Terms of Use.