Points to consider
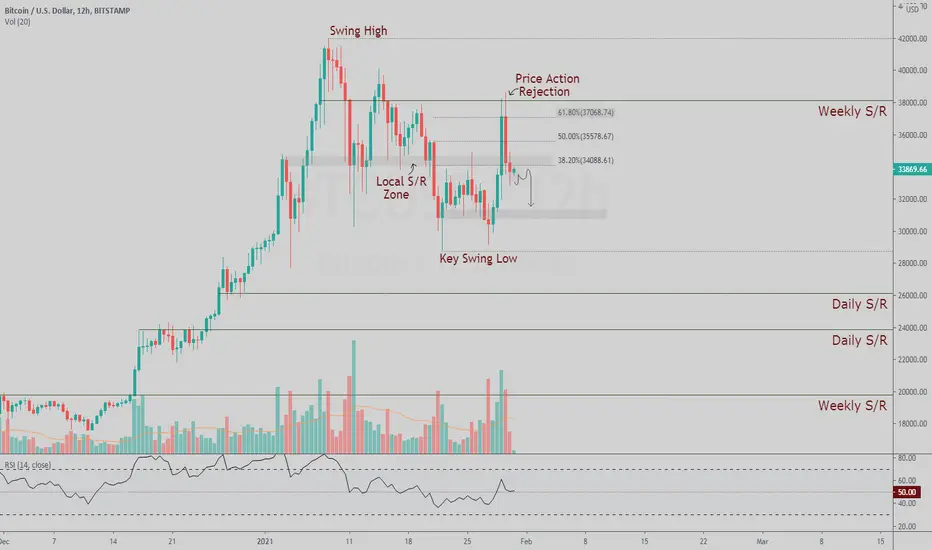
Preluding to the chart above, Price Action has had a strong Short-Squeeze into the Weekly S/R that is in technical confluence with the, .618 Fibonacci Retracement. BTCUSD failed to close above this level leading to a Bearish Volatility Expansion, planting yet another Lower High on the chart.
The Local S/R Zone is current resistance as candles are below the level on a closing basis. This shows weakness in the immediate short term allowing for a bearish bias. It is allows important to note that the .382 Fibonacci Retracement is of technical confluence with the Local S/R Zone adding to more resistance.
BTCUSD’s current Swing Low is critical to be held, losing this will greatly increase the probability of testing the lower Daily S/R. This will also confirmed a new Lower Low, Price Action will then have an established Bearish Trend.
Price Action RSI,
Observing the RSI, BTCUSD is at a true pivotal trade location where an impulse in either direction can determine the overall trend. Breaking below the Range-Mid will increase the bearish biased scenario, further downside being probable. Confirming a Retest with an influx will maintain the Bullish Control Zone, indicative of strength in the immediate short term.
Disclaimer
The information and publications are not meant to be, and do not constitute, financial, investment, trading, or other types of advice or recommendations supplied or endorsed by TradingView. Read more in the Terms of Use.
Disclaimer
The information and publications are not meant to be, and do not constitute, financial, investment, trading, or other types of advice or recommendations supplied or endorsed by TradingView. Read more in the Terms of Use.