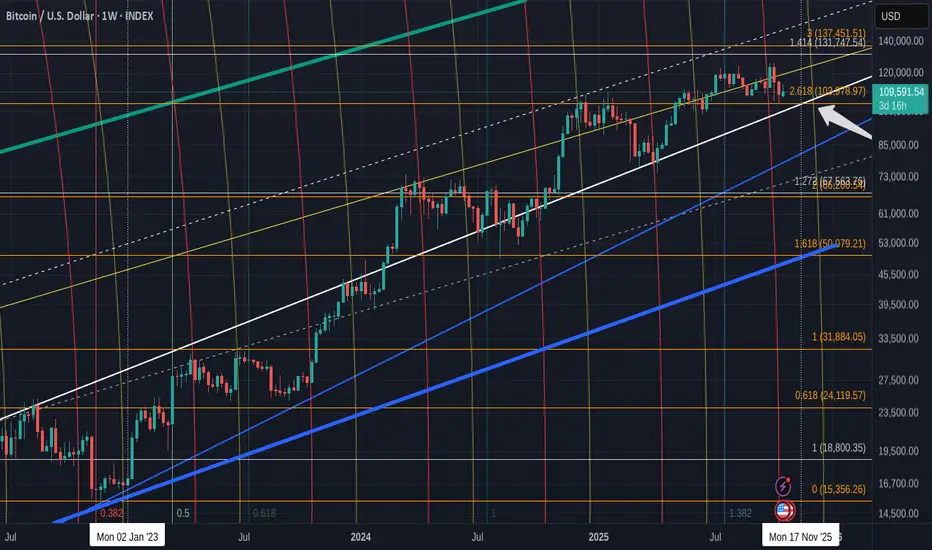
This chart is one of my oldest and most trusted charts.
Thhis main chart is Weekly and from the end weeks of the Bear in 2022. You can see wre January 2023 is marked and so we can see the rising channels that developed.
The Blue Bold line is a Long term line if support from 2013 that we may never visit again.
There are 2 lines I want to draw your attention to.
The rising bold White line that acted as strong resistance in August 2022 and was turned in to Support in early 2024.
It has been strong support ever since.
The other is the 2.618 Fib extension ( Arrow ).
This line was resistance in early 2025 and remained so until crossed in around June this year.
It has been support ever since.
PA is heading towards the intersection of these two lines in Mid November ( around 17th ). PA could react before this date but it is very possible that PA will rise to a new ATH from this point.
The 2.618 Fib was tested recently in that Sudden Drop and we can see this on the daily chart below.
See that last wick down ? For me, the fact that this Snowballing liquidation was stopped by that line, shows massive strength of support there.
We can also see that rising line of support worked well in April this year.
These are 2 very strong lines of support and PA is above both of them and heading to the intersection of the two in November.
But what supports this idea further ?
The Weekly RSI is in a zone that previous occasions have bounced from, though it could fall a little further, giving a delay in PA rising.
November 17 is just over 3 weeks away. We may see RSI rise, Dip, rise
The weekly MACD also offers some insights
The weekly MACD is dropping bearish and its projected line till it reaches support is around end of November. Later than the 17th November
The Daily MACD may show us the idea of a bounce for the short term
MACD is turning up from OVERSOLD but we need to see what happens over the next few weeks closely. The idea that a short term Bounce in the Daily MACD also supports the idea of the RSI bouncing up down up, as mentioned above.
Something that I do find very interesting is the change in MVRV this cycle.
I have never seem MVRV rising in a channel like this and what is more interesting is how the Z Score ( yellow ) has bounced off the lower trend line twice previously.
And it is heading towards that line again, with a projected Touch around 27 November.
SO, all in all, we have Bitcoin Above Strong Support, heading to a point of intersection that has the potential to push PA higher.
That push could then be supported a little after with strong support from Technicals.
This may Push Bitcoin PA in a sustained rise with next major resistance levels at 137K
We need to get above and Hold that level.
BUT, as ever, MACRO could take over and we have, next week, the FED interest rate decision.
However, NOVEMBER is the focus here.
The Federal Reserve does not have a scheduled FOMC meeting in November 2025. The next meeting after October 28-29, 2025, is scheduled for December 9-10, 2025
This could be VERY INTERESTING Q4
Stay safe
Nothing to be taken as Financial advice.
I will always say
"Only invest what you can afford to loose. When you are ready, take out your original investment. This way, it is only your profit that is at risk"
THAT is Financial advice
I will always say
"Only invest what you can afford to loose. When you are ready, take out your original investment. This way, it is only your profit that is at risk"
THAT is Financial advice
Disclaimer
The information and publications are not meant to be, and do not constitute, financial, investment, trading, or other types of advice or recommendations supplied or endorsed by TradingView. Read more in the Terms of Use.