** Candle Colours are effected by a Bull Bear indicator, indicating Bull Bear sentiment...
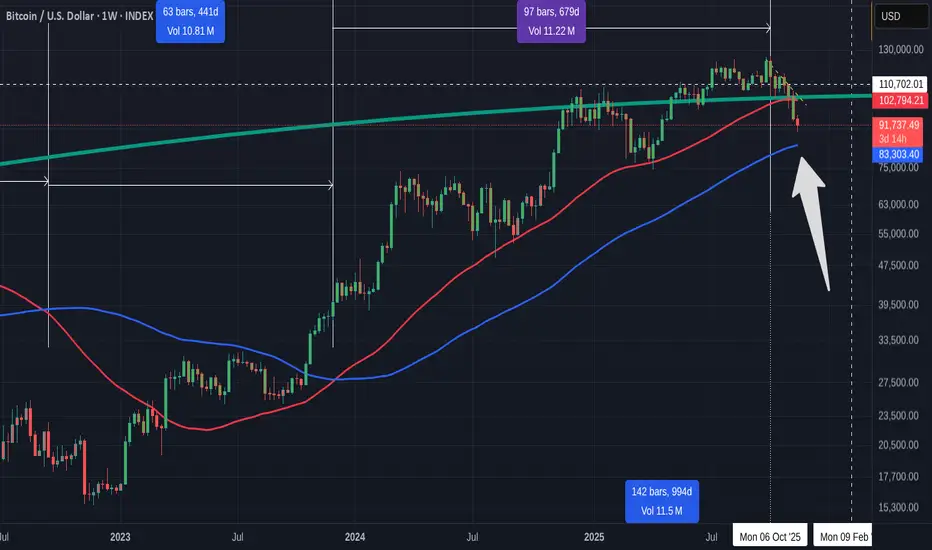
Note THIS week is the First BEAR week Candle in a very long time, since March 2025
Bitcoin Lost the 50 SMA ( RED ), first time this Cycle.
And we see the 100 SMA ( BLUE ) running parallel and so, this s logically the next level of support should we drop lower.
What is the relevance of the 50 & 100 SMA to Bitcoin PA

This is the Bitcoin Chart since December 2013
The Labels above are the day counts from ATH, to the SMA crossing Bearish ( 50 dropping below the 100
To when the SMA cross Bullish ( 50 rises back above the 100 ) and then to ATH
The Lower day count is from when the 50 crosses above the 100 to when it crosses back below.
And Many things point to the fact that we may well have past the ATH point and are now entering the Bear Market.
Loosing the 50 backs this up to many extents.

So now we look to the 100 to see if PA holds 83K or not.
Interesting to note, that because of how Calmly this "Cycle" has preformed ,, Haw parallel the 50 and 100 are to each other, we are reaching gown to the 100 Much quicker than previous occasions. Very interested to see what happens.
SOPR has just flashed a BEARISH signal

People are capitulating, selling in Fear and making Losses.
A Sure sign of the BEAR.
But there Many things that support the idea that this is NOT the end of this Run to True ATH.
For me, this is helped by the fact that the RSI is so near OVERSOLD that it will RISE.
Not a Guarantee though

But we also have the Weekly MACD down low too

You can see on this chart how the Histogram tends to find support on this level
The MACD line has Crossed below Neutral.
We are in an area for a bounce.
This may not happen and it is impossible to predict this
We need to continue watching and see where the PA goes on that 100 SMA
I have been doing TA for many years now and I have to say, this time, Things are a lot more conveluted than normal..Many conflicting signals....
We have Short Term and Long Term ideas presenting cases for both Bullish and Bearish scenarios.
So, We wait to see what happens on the 100
Look at the Long Term chart and see what happens when the PA crosses the 100 ( Blue )
We need that Bounce for the Bulls
PA Drops below, BEARS
Note THIS week is the First BEAR week Candle in a very long time, since March 2025
Bitcoin Lost the 50 SMA ( RED ), first time this Cycle.
And we see the 100 SMA ( BLUE ) running parallel and so, this s logically the next level of support should we drop lower.
What is the relevance of the 50 & 100 SMA to Bitcoin PA
This is the Bitcoin Chart since December 2013
The Labels above are the day counts from ATH, to the SMA crossing Bearish ( 50 dropping below the 100
To when the SMA cross Bullish ( 50 rises back above the 100 ) and then to ATH
The Lower day count is from when the 50 crosses above the 100 to when it crosses back below.
And Many things point to the fact that we may well have past the ATH point and are now entering the Bear Market.
Loosing the 50 backs this up to many extents.
So now we look to the 100 to see if PA holds 83K or not.
Interesting to note, that because of how Calmly this "Cycle" has preformed ,, Haw parallel the 50 and 100 are to each other, we are reaching gown to the 100 Much quicker than previous occasions. Very interested to see what happens.
SOPR has just flashed a BEARISH signal
People are capitulating, selling in Fear and making Losses.
A Sure sign of the BEAR.
But there Many things that support the idea that this is NOT the end of this Run to True ATH.
For me, this is helped by the fact that the RSI is so near OVERSOLD that it will RISE.
Not a Guarantee though
But we also have the Weekly MACD down low too
You can see on this chart how the Histogram tends to find support on this level
The MACD line has Crossed below Neutral.
We are in an area for a bounce.
This may not happen and it is impossible to predict this
We need to continue watching and see where the PA goes on that 100 SMA
I have been doing TA for many years now and I have to say, this time, Things are a lot more conveluted than normal..Many conflicting signals....
We have Short Term and Long Term ideas presenting cases for both Bullish and Bearish scenarios.
So, We wait to see what happens on the 100
Look at the Long Term chart and see what happens when the PA crosses the 100 ( Blue )
We need that Bounce for the Bulls
PA Drops below, BEARS
Nothing to be taken as Financial advice.
I will always say
"Only invest what you can afford to loose. When you are ready, take out your original investment. This way, it is only your profit that is at risk"
THAT is Financial advice
I will always say
"Only invest what you can afford to loose. When you are ready, take out your original investment. This way, it is only your profit that is at risk"
THAT is Financial advice
Disclaimer
The information and publications are not meant to be, and do not constitute, financial, investment, trading, or other types of advice or recommendations supplied or endorsed by TradingView. Read more in the Terms of Use.