Some short term Bearish and Bullish odeas.
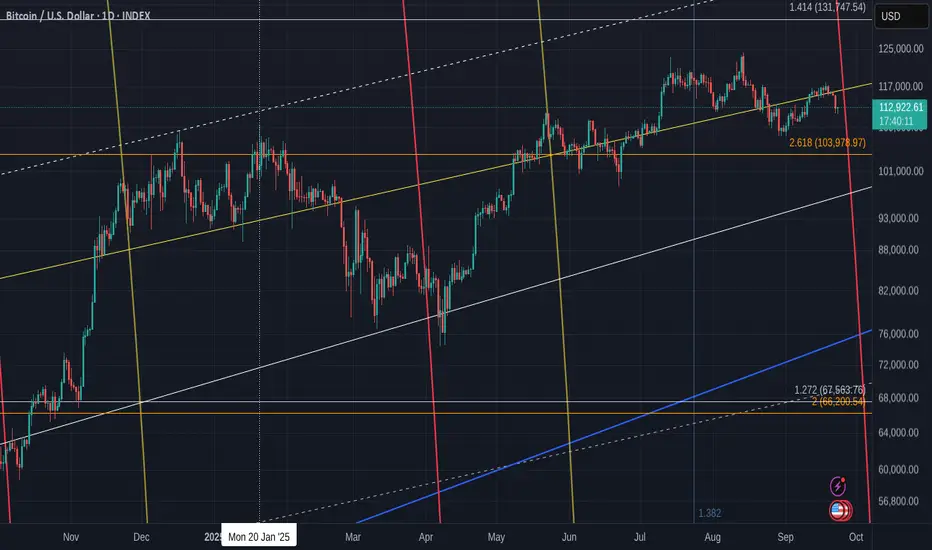
That red "line" near current PA is a 236 Fib circle and, as you will know if you been reading my posts, These Often provide Downside.
As a result, I am looking to see a price near or slightly below 100K before a turn around.
That would bring us to the 2.236 Fib Extension line.
Should that fail, 96K is the next line that should hold
The Daily MACD also supports a further drop
MACD just turned Bearish above neutral line. It may find support on the Neutral line for a shorter term bounce.
The RSI may support the idea of a push back
We can see that the RSI has stopped dropping and so this may indicate a reversal is about to play out.
We have to watch and wait.
This time next week is the last day of September.
The Month Candle needs to close GREEN to keep Bullish sentiment. It is currently Still Green.
A Red Close and things would certainly appear to be a little more Bearish.
October is a predominantly more Bullish month normaly.
This next week should see a bounce if we are in a bullish run still.
However, as mentioned above, there is still room on that green Candle for a Dip Lower.
Or we may close Green, The Dip and then push higher.
So many options.
Nothing to be taken as Financial advice.
I will always say
"Only invest what you can afford to loose. When you are ready, take out your original investment. This way, it is only your profit that is at risk"
THAT is Financial advice
I will always say
"Only invest what you can afford to loose. When you are ready, take out your original investment. This way, it is only your profit that is at risk"
THAT is Financial advice
Disclaimer
The information and publications are not meant to be, and do not constitute, financial, investment, trading, or other types of advice or recommendations supplied or endorsed by TradingView. Read more in the Terms of Use.