📉  BTC Weekly Chart Update
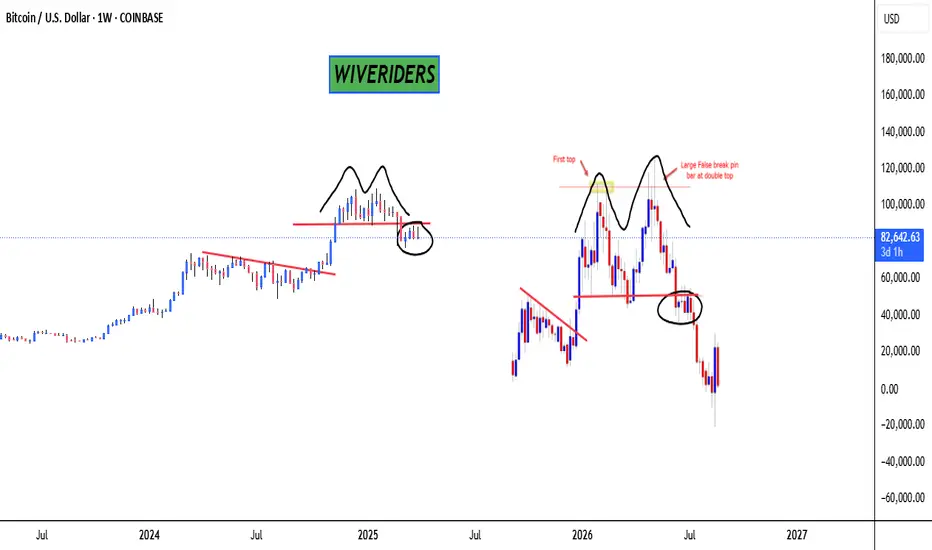
It looks like a double top pattern is clearly forming on the BTC weekly chart — and honestly, doesn't it remind you of a similar structure we’ve seen before? 👀
Patterns like these often signal potential trend reversals, so this is definitely a chart to watch closely.
Do you see the similarity with the previous one? Let me know your thoughts in the comments 👇
🔴 Bearish scenario could continue unless we break above key resistance.
Disclaimer
The information and publications are not meant to be, and do not constitute, financial, investment, trading, or other types of advice or recommendations supplied or endorsed by TradingView. Read more in the Terms of Use.
Disclaimer
The information and publications are not meant to be, and do not constitute, financial, investment, trading, or other types of advice or recommendations supplied or endorsed by TradingView. Read more in the Terms of Use.