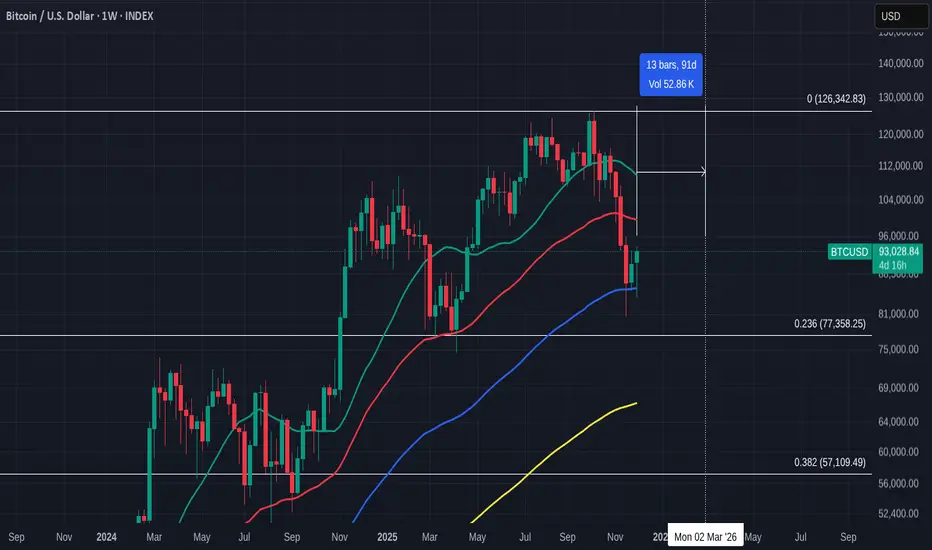
50 Week SMA ( RED )
100 Week SMA ( BLUE )
In the Chart above, take Note of the Drop in PA after the first ATH and how PA bounced off the 50 week SMA ( RED ), Bounced up to a New ATH and then Dropped back, fell through the 50 and is currently Bouncing off the 100 Week SMA ( BLUE )
Also notice the 91 day count, which takes us to March 2026
Also note how all this has happened between the 0 and 0.236 Fib retracement lines.
Now lets look at what happened in 2021

The Drop in PA after the first ATH and how PA bounced off the 50 SMA area , Bounced up to a New ATH and then Dropped back, fell through the 50 and Bounced off the 100 SMA
Almost EXACTLY what we are currently Seeing.
That bounce, that we maybe currently recreating, lasted 91 days before it fell through and into the Bear market.
Notice how PA got rejected by the 21 SMA ( GREEN ) before it fell through the 236 Fib line
For me, that Bear Market began as soon as PA fell through the 236 Fib line.
Should we recreate that 2021 sequence, it may look something like this

We currently have not yet returned to the 236 Fib Line as we did in 2021.This gives us a little more Room to move thankfully.
But we should certainly keep an eye on that 21 Week SMA.
Bells will Ring when the 21 crosses under the 50
This may get invalidated if PA rises and remains above the Jan 2025 ATH at around 108K usdt
We Wait, Time will tell
100 Week SMA ( BLUE )
In the Chart above, take Note of the Drop in PA after the first ATH and how PA bounced off the 50 week SMA ( RED ), Bounced up to a New ATH and then Dropped back, fell through the 50 and is currently Bouncing off the 100 Week SMA ( BLUE )
Also notice the 91 day count, which takes us to March 2026
Also note how all this has happened between the 0 and 0.236 Fib retracement lines.
Now lets look at what happened in 2021
The Drop in PA after the first ATH and how PA bounced off the 50 SMA area , Bounced up to a New ATH and then Dropped back, fell through the 50 and Bounced off the 100 SMA
Almost EXACTLY what we are currently Seeing.
That bounce, that we maybe currently recreating, lasted 91 days before it fell through and into the Bear market.
Notice how PA got rejected by the 21 SMA ( GREEN ) before it fell through the 236 Fib line
For me, that Bear Market began as soon as PA fell through the 236 Fib line.
Should we recreate that 2021 sequence, it may look something like this
We currently have not yet returned to the 236 Fib Line as we did in 2021.This gives us a little more Room to move thankfully.
But we should certainly keep an eye on that 21 Week SMA.
Bells will Ring when the 21 crosses under the 50
This may get invalidated if PA rises and remains above the Jan 2025 ATH at around 108K usdt
We Wait, Time will tell
Nothing to be taken as Financial advice.
I will always say
"Only invest what you can afford to loose. When you are ready, take out your original investment. This way, it is only your profit that is at risk"
THAT is Financial advice
I will always say
"Only invest what you can afford to loose. When you are ready, take out your original investment. This way, it is only your profit that is at risk"
THAT is Financial advice
Disclaimer
The information and publications are not meant to be, and do not constitute, financial, investment, trading, or other types of advice or recommendations supplied or endorsed by TradingView. Read more in the Terms of Use.