In this guide will the trendbreaks be discussed. The following subjects will be explained:
- What is a trend?
- What is a bearish trendline break?
- What is a bullish trendline break?
- How to trade a trendbreak?
- Example
What is a trend?
A trend is the backbone of price action in any market. It represents the general direction in which price is moving over a sustained period of time. When price is consistently creating higher highs and higher lows, the market is considered to be in an uptrend. This behavior shows that buyers are in control and are willing to keep paying higher prices with each wave. On the other hand, when price continues to make lower highs and lower lows, the market is in a downtrend. This shows that sellers dominate the market and buyers are unable to push price above previous levels. Understanding trends is essential because it gives traders a framework for anticipating what is most likely to happen next, rather than guessing in random price action.
What is a bearish trendline break?
A bearish trendline break takes place when an established uptrend begins to lose momentum. In an uptrend, price usually respects a rising trendline, bouncing off it multiple times as buyers defend the bullish structure. Eventually, there comes a point when the market can no longer sustain this strength. Price breaks down through the rising trendline, signaling potential weakness. However, the true confirmation of a bearish shift only happens once the market also breaks below the most recent higher low. This is the key moment where structure changes. What was once a sequence of higher highs and higher lows now transforms into lower highs and lower lows, showing that sellers are gaining control. Without this structural shift, the break of the trendline alone might just be a temporary pullback or a false signal.

What is a bullish trendline break?
A bullish trendline break is the mirror image. In a downtrend, price respects a falling trendline as it consistently makes lower highs and lower lows. Each rally upward fails to break past previous highs, confirming sellers’ control. Eventually, price surges and breaks above the falling trendline. Just like with a bearish break, this initial move is not enough on its own. The true sign of reversal comes when price also breaks above the most recent lower high. This action destroys the existing bearish structure, which relied on lower highs to remain valid. Once that lower high is broken, the market shows that buyers have taken back control and a potential uptrend may begin.

How to trade a trendbreak?
For a valid trendbreak, three conditions must come together. First, the price must break the trendline itself, either rising or falling depending on the direction of the trend. Secondly, the breakout needs to be with strong volume. lastly, the price must also break the most recent higher low in an uptrend or lower high in a downtrend. Without this structural break, what looks like a reversal may only be a correction before the market resumes in its original direction. This distinction is crucial because many traders enter too early on a simple trendline break, only to get caught when the market snaps back into the trend. The combination of both the trendline break and the structural break provides much stronger confirmation.
Trading the trendbreak is where discipline and patience make the difference between success and failure. When the structure has been broken, it is tempting to enter immediately in the direction of the new move. But the higher-probability entry usually comes from waiting. Price often pulls back after a break, returning to retest the broken level. This retest can take different forms. Sometimes price simply returns to the broken higher low or lower high and uses it as support or resistance. Other times, price fills what traders call a fair value gap (fvg), which is an imbalance left on the chart when price moves too quickly in one direction without much trading in between. By waiting for this retest, a trader enters at a better price, with a tighter stop loss and greater profit potential.
Example
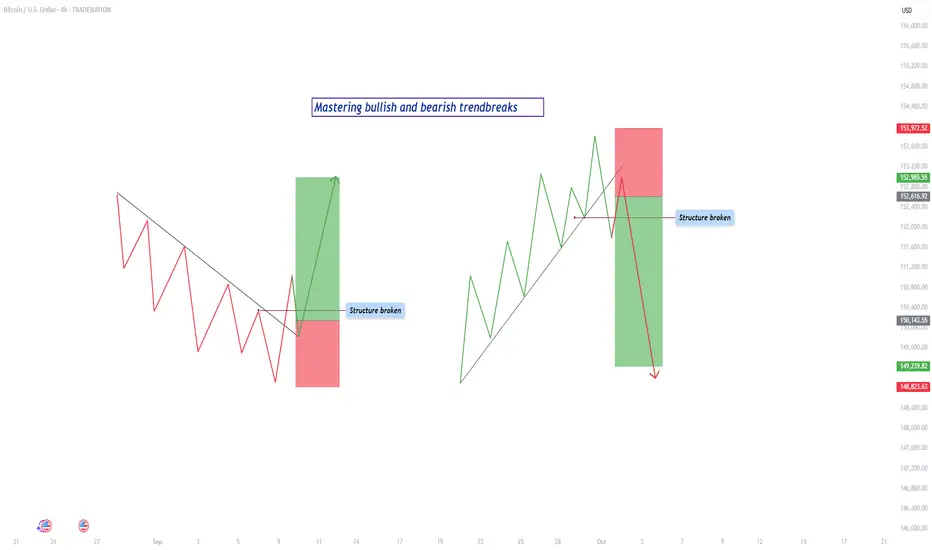
For example, imagine the market in an uptrend. Price respects a rising trendline until it finally breaks through it. Shortly after, the market breaks below the most recent higher low, confirming the bearish trendbreak. Instead of selling right at the break, the disciplined trader waits. Price pulls back upward to retest the broken higher low, which now acts as resistance. At that moment, the trader sells with a stop loss just above the retest level and targets the next support or previous swing low. This provides a controlled risk and larger potential reward.
The same logic applies to a bullish trendbreak. Price in a downtrend breaks above the falling trendline, then pushes higher to break a lower high, flipping the structure bullish. Price later dips back down to retest the broken lower high or fills a fair value gap. When it holds and begins to rise again, the trader enters long, with a stop below the retest and a target at the next resistance level.
By combining awareness of trendlines, structural shifts, and retest opportunities, traders can filter out false signals and position themselves to catch the early stages of new trends. The trendbreak is not just about spotting the first sign of weakness or strength, but about confirming that the underlying structure has truly changed. This approach gives a trader clarity, consistency, and confidence in execution, making trendbreaks one of the most powerful tools for price action trading.
-------------------------
Disclosure: I am part of Trade Nation's Influencer program and receive a monthly fee for using their TradingView charts in my analysis.
Thanks for your support. If you enjoyed this analysis, make sure to follow me so you don't miss the next one. And if you found it helpful, feel free to drop a like 👍 and leave a comment 💬, I’d love to hear your thoughts!
- What is a trend?
- What is a bearish trendline break?
- What is a bullish trendline break?
- How to trade a trendbreak?
- Example
What is a trend?
A trend is the backbone of price action in any market. It represents the general direction in which price is moving over a sustained period of time. When price is consistently creating higher highs and higher lows, the market is considered to be in an uptrend. This behavior shows that buyers are in control and are willing to keep paying higher prices with each wave. On the other hand, when price continues to make lower highs and lower lows, the market is in a downtrend. This shows that sellers dominate the market and buyers are unable to push price above previous levels. Understanding trends is essential because it gives traders a framework for anticipating what is most likely to happen next, rather than guessing in random price action.
What is a bearish trendline break?
A bearish trendline break takes place when an established uptrend begins to lose momentum. In an uptrend, price usually respects a rising trendline, bouncing off it multiple times as buyers defend the bullish structure. Eventually, there comes a point when the market can no longer sustain this strength. Price breaks down through the rising trendline, signaling potential weakness. However, the true confirmation of a bearish shift only happens once the market also breaks below the most recent higher low. This is the key moment where structure changes. What was once a sequence of higher highs and higher lows now transforms into lower highs and lower lows, showing that sellers are gaining control. Without this structural shift, the break of the trendline alone might just be a temporary pullback or a false signal.
What is a bullish trendline break?
A bullish trendline break is the mirror image. In a downtrend, price respects a falling trendline as it consistently makes lower highs and lower lows. Each rally upward fails to break past previous highs, confirming sellers’ control. Eventually, price surges and breaks above the falling trendline. Just like with a bearish break, this initial move is not enough on its own. The true sign of reversal comes when price also breaks above the most recent lower high. This action destroys the existing bearish structure, which relied on lower highs to remain valid. Once that lower high is broken, the market shows that buyers have taken back control and a potential uptrend may begin.
How to trade a trendbreak?
For a valid trendbreak, three conditions must come together. First, the price must break the trendline itself, either rising or falling depending on the direction of the trend. Secondly, the breakout needs to be with strong volume. lastly, the price must also break the most recent higher low in an uptrend or lower high in a downtrend. Without this structural break, what looks like a reversal may only be a correction before the market resumes in its original direction. This distinction is crucial because many traders enter too early on a simple trendline break, only to get caught when the market snaps back into the trend. The combination of both the trendline break and the structural break provides much stronger confirmation.
Trading the trendbreak is where discipline and patience make the difference between success and failure. When the structure has been broken, it is tempting to enter immediately in the direction of the new move. But the higher-probability entry usually comes from waiting. Price often pulls back after a break, returning to retest the broken level. This retest can take different forms. Sometimes price simply returns to the broken higher low or lower high and uses it as support or resistance. Other times, price fills what traders call a fair value gap (fvg), which is an imbalance left on the chart when price moves too quickly in one direction without much trading in between. By waiting for this retest, a trader enters at a better price, with a tighter stop loss and greater profit potential.
Example
For example, imagine the market in an uptrend. Price respects a rising trendline until it finally breaks through it. Shortly after, the market breaks below the most recent higher low, confirming the bearish trendbreak. Instead of selling right at the break, the disciplined trader waits. Price pulls back upward to retest the broken higher low, which now acts as resistance. At that moment, the trader sells with a stop loss just above the retest level and targets the next support or previous swing low. This provides a controlled risk and larger potential reward.
The same logic applies to a bullish trendbreak. Price in a downtrend breaks above the falling trendline, then pushes higher to break a lower high, flipping the structure bullish. Price later dips back down to retest the broken lower high or fills a fair value gap. When it holds and begins to rise again, the trader enters long, with a stop below the retest and a target at the next resistance level.
By combining awareness of trendlines, structural shifts, and retest opportunities, traders can filter out false signals and position themselves to catch the early stages of new trends. The trendbreak is not just about spotting the first sign of weakness or strength, but about confirming that the underlying structure has truly changed. This approach gives a trader clarity, consistency, and confidence in execution, making trendbreaks one of the most powerful tools for price action trading.
-------------------------
Disclosure: I am part of Trade Nation's Influencer program and receive a monthly fee for using their TradingView charts in my analysis.
Thanks for your support. If you enjoyed this analysis, make sure to follow me so you don't miss the next one. And if you found it helpful, feel free to drop a like 👍 and leave a comment 💬, I’d love to hear your thoughts!
🔸 Free trading Discord
discord.gg/fVfJHHQSMG
🔹 Free trading signals
t.me/CandleCollective
discord.gg/fVfJHHQSMG
🔹 Free trading signals
t.me/CandleCollective
Disclaimer
The information and publications are not meant to be, and do not constitute, financial, investment, trading, or other types of advice or recommendations supplied or endorsed by TradingView. Read more in the Terms of Use.