Bitcoin - Last drop, then a huge pump! (watch this wedge)Bitcoin is currently trading at around 78,000 at the time of writing this article, and I expect the price to go down to 71k - 72k in the short term. Why? As we can see on the chart, there are many reasons why Bitcoin should go down. The first reason is that whales (banks, institutions) still didn't
About Bitcoin / TetherUS
Bitcoin, the first and most popular cryptocurrency, is known for its price volatility driven by institutional demand, regulations, and global events, while Tether (USDT) is widely used as a stable trading pair to avoid converting back to fiat. Together, Bitcoin and Tether play a central role in crypto markets, with Tether’s stability supporting Bitcoin trading and influencing investor behavior.
Related pairs

Trusting Your System After a Losing StreakTrusting Your System After a Losing Streak
Welcome everybody to another educational article.
Today we are covering one of the hardest moments every trader, beginner, novice or pro will face:
“Trusting your system after a losing streak.”
This is where most traders ditch profitable systems not bec

BTCUSD Daily CLS Model 1 - Short term BuyHi friends, new range created. As always we are looking for the manipulation in to the key level around the range. Don't forget confirmation switch from manipulation phase to the distribution phase to make the setup valid. Stay patient and enter only after change in order flow. If price reaches 50%

BTCUSDT: Reacts to Key Support - Corrective Bounce To $82,200Hello everyone, here is my breakdown of the current BTCUSDT setup.
Market Analysis
BTCUSDT was previously trading within a well-defined upward channel, where price respected both the rising support and resistance boundaries, printing higher highs and higher lows. This structure clearly confirmed

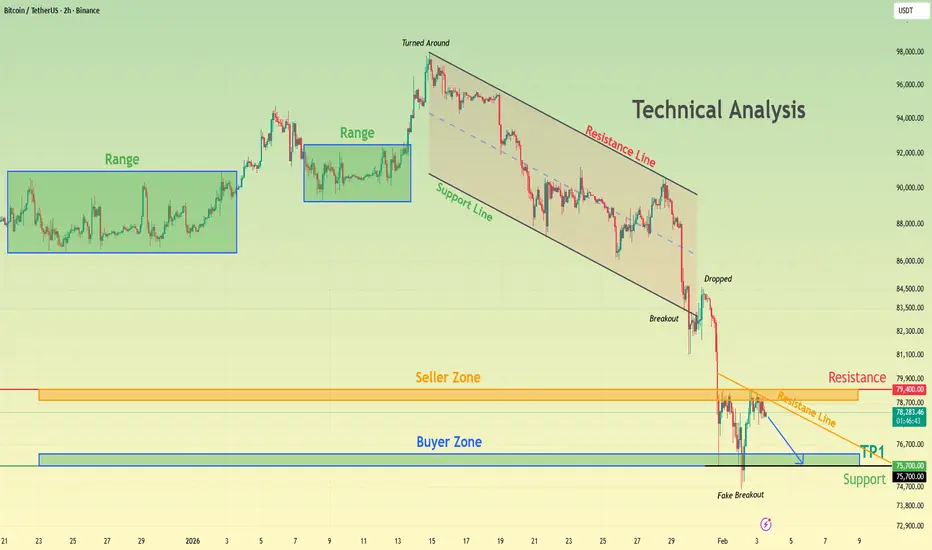
BTCUSDT: Fake Breakout From Support Signals Potential Long SetupHello everyone, here is my breakdown of the current BTCUSDT setup.
Market Analysis
BTCUSDT previously traded within a large symmetrical triangle, where price was gradually compressing between the triangle resistance and support lines. This phase reflected market indecision and liquidity buildup,

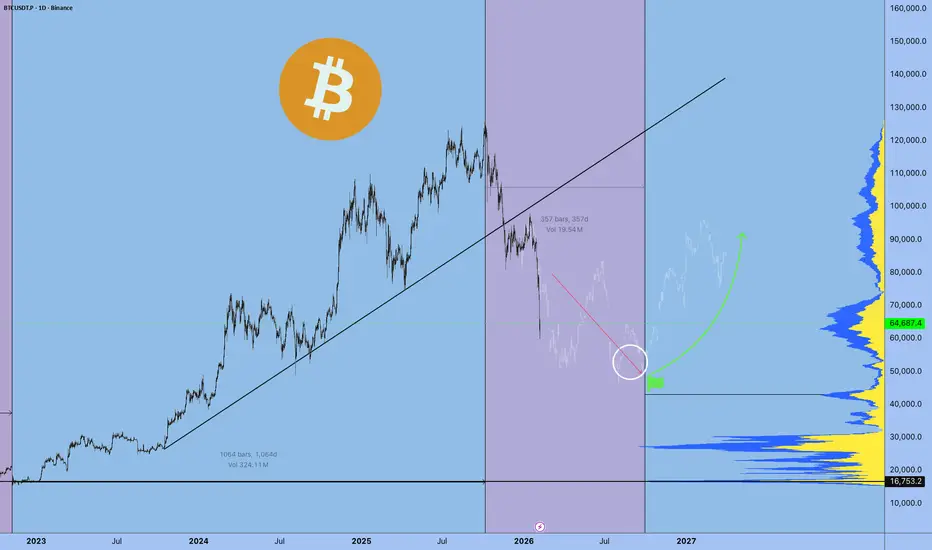
This Isn’t a Reversal — It’s Only Phase Two. $BTC>65k Thank you for your attention! This is exactly what you've been hearing since September 2025. Next, we'll form the bottom, and reaccumulate until October.
A smart person told me to stop posting publicly. Make everything private, but I continue to publish my thoughts for you.
There are no entry point
BTCUSDT Bearish Structure Holds - Short From ResistanceHello traders! Here’s my technical outlook on BTCUSDT (2H) based on the current chart structure. Bitcoin initially traded within a clearly defined range, where price moved sideways for an extended period, indicating market equilibrium and accumulation before the next directional move. This ranging p
Bitcoin - Outlook for the Upcoming WeeksMarket Overview
Bitcoin is currently trading under clear higher timeframe pressure after a strong reaction from a premium zone. Price tapped into a confluence area of weekly and monthly Fair Value Gaps and showed immediate rejection, confirming that sellers are active at these levels. This reaction

Bitcoin Weekly Roadmap: 50_SMA(Weekly) Lost — $70K Break Next?Let’s start with my previous weekly analysis on Bitcoin from Jul 11, 2025 , which showed that when higher timeframe technical analysis is done right, it can be impactful and help capture key trends. Back then, we identified the All-Time High(ATH=$126,199) and the subsequent correction accurately.

Bitcoin at High-Probability Reversal Zone – Long Setup in PlayAs I expected in the previous idea , Bitcoin( BINANCE:BTCUSDT ) started declining and reached its full target.
Right now, Bitcoin has entered the heavy support zone($78,260-$70,080). Generally, strong support and resistance zones don’t break with just one attempt. On a daily timeframe, this is the

See all ideas
Summarizing what the indicators are suggesting.
Oscillators
Neutral
SellBuy
Strong sellStrong buy
Strong sellSellNeutralBuyStrong buy
Oscillators
Neutral
SellBuy
Strong sellStrong buy
Strong sellSellNeutralBuyStrong buy
Summary
Neutral
SellBuy
Strong sellStrong buy
Strong sellSellNeutralBuyStrong buy
Summary
Neutral
SellBuy
Strong sellStrong buy
Strong sellSellNeutralBuyStrong buy
Summary
Neutral
SellBuy
Strong sellStrong buy
Strong sellSellNeutralBuyStrong buy
Moving Averages
Neutral
SellBuy
Strong sellStrong buy
Strong sellSellNeutralBuyStrong buy
Moving Averages
Neutral
SellBuy
Strong sellStrong buy
Strong sellSellNeutralBuyStrong buy
Displays a symbol's price movements over previous years to identify recurring trends.
Frequently Asked Questions
The current price of Bitcoin / TetherUS (BTC) is 70,316.05 USDT — it has fallen −2.24% in the past 24 hours. Try placing this info into the context by checking out what coins are also gaining and losing at the moment and seeing BTC price chart.
Bitcoin / TetherUS price has fallen by −18.12% over the last week, its month performance shows a −24.49% decrease, and as for the last year, Bitcoin / TetherUS has decreased by −27.14%. See more dynamics on BTC price chart.
Keep track of coins' changes with our Crypto Coins Heatmap.
Keep track of coins' changes with our Crypto Coins Heatmap.
Bitcoin / TetherUS (BTC) reached its highest price on Oct 6, 2025 — it amounted to 126,199.63 USDT. Find more insights on the BTC price chart.
See the list of crypto gainers and choose what best fits your strategy.
See the list of crypto gainers and choose what best fits your strategy.
Bitcoin / TetherUS (BTC) reached the lowest price of 2,817.00 USDT on Sep 15, 2017. View more Bitcoin / TetherUS dynamics on the price chart.
See the list of crypto losers to find unexpected opportunities.
See the list of crypto losers to find unexpected opportunities.
The safest choice when buying BTC is to go to a well-known crypto exchange. Some of the popular names are Binance, Coinbase, Kraken. But you'll have to find a reliable broker and create an account first. You can trade BTC right from TradingView charts — just choose a broker and connect to your account.
Crypto markets are famous for their volatility, so one should study all the available stats before adding crypto assets to their portfolio. Very often it's technical analysis that comes in handy. We prepared technical ratings for Bitcoin / TetherUS (BTC): today its technical analysis shows the sell signal, and according to the 1 week rating BTC shows the sell signal. And you'd better dig deeper and study 1 month rating too — it's sell. Find inspiration in Bitcoin / TetherUS trading ideas and keep track of what's moving crypto markets with our crypto news feed.
Bitcoin / TetherUS (BTC) is just as reliable as any other crypto asset — this corner of the world market is highly volatile. Today, for instance, Bitcoin / TetherUS is estimated as 2.77% volatile. The only thing it means is that you must prepare and examine all available information before making a decision. And if you're not sure about Bitcoin / TetherUS, you can find more inspiration in our curated watchlists.
You can discuss Bitcoin / TetherUS (BTC) with other users in our public chats, Minds or in the comments to Ideas.