After breaking below the 107K support level, Bitcoin retested the area and then extended its decline.
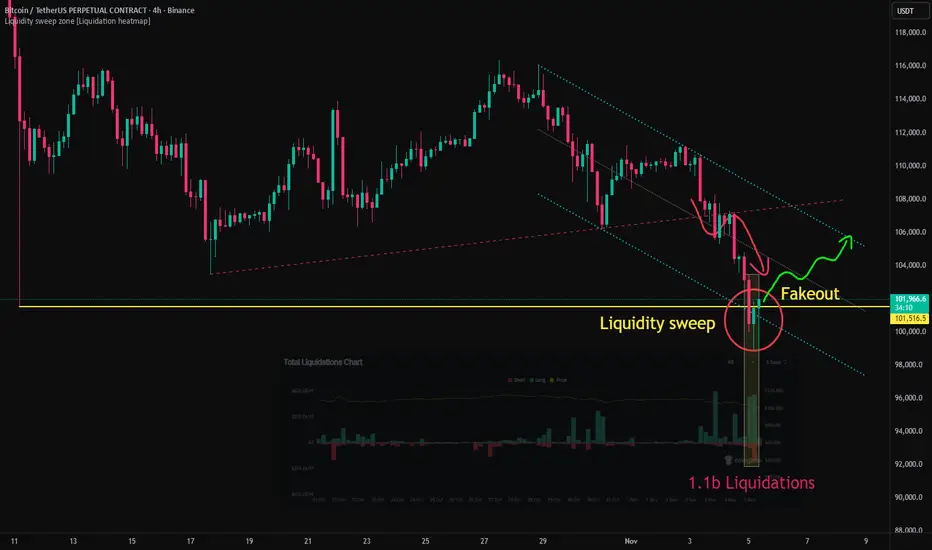
As the downtrend intensified, the price broke through 102K, which was the low recorded during the large-scale liquidation event on October 11, and subsequently lost the psychological support level at 100K.

During the eight-hour period of this decline, approximately 1.1 billion USD worth of long positions were liquidated, accompanied by both a liquidity sweep and a fakeout pattern.
The simultaneous occurrence of large-scale liquidations, increased trading volume, a fakeout pattern, and the process of filling the CME gap indicates that multiple short-term reversal signals emerged in this zone.

From a technical standpoint, there is an increasing likelihood of two consecutive bullish candles with long lower wicks forming on the 4-hour chart, while the 12-hour chart also shows a high probability of developing a bullish candle with a long lower shadow.
This suggests a growing possibility of a short-term rebound, with the potential upside target near the upper boundary of the descending parallel channel.
As the downtrend intensified, the price broke through 102K, which was the low recorded during the large-scale liquidation event on October 11, and subsequently lost the psychological support level at 100K.
During the eight-hour period of this decline, approximately 1.1 billion USD worth of long positions were liquidated, accompanied by both a liquidity sweep and a fakeout pattern.
The simultaneous occurrence of large-scale liquidations, increased trading volume, a fakeout pattern, and the process of filling the CME gap indicates that multiple short-term reversal signals emerged in this zone.
From a technical standpoint, there is an increasing likelihood of two consecutive bullish candles with long lower wicks forming on the 4-hour chart, while the 12-hour chart also shows a high probability of developing a bullish candle with a long lower shadow.
This suggests a growing possibility of a short-term rebound, with the potential upside target near the upper boundary of the descending parallel channel.
Trade active
[images]A trend breakout has occurred in the USDT dominance chart. Typically, the USDT.D chart moves inversely to Bitcoin, and if the downtrend in USDT dominance continues, Bitcoin is likely to maintain its upward momentum.
[images]
Trade closed: target reached
We've hit our initial price target. Bitcoin is currently undergoing a correction within a liquidity zone, and a momentary fakeout is possible. This juncture presents an excellent opportunity to enter a long position, offering a risk-to-reward ratio of 1:5.Crypto trader. Scalping, counter-trend trading.
Check out my profile for more useful indicators.
Introduction to Bitcoin Chart Analysis and Indicators.
Youtube : youtube.com/@mensascalper
Check out my profile for more useful indicators.
Introduction to Bitcoin Chart Analysis and Indicators.
Youtube : youtube.com/@mensascalper
Related publications
Disclaimer
The information and publications are not meant to be, and do not constitute, financial, investment, trading, or other types of advice or recommendations supplied or endorsed by TradingView. Read more in the Terms of Use.
Crypto trader. Scalping, counter-trend trading.
Check out my profile for more useful indicators.
Introduction to Bitcoin Chart Analysis and Indicators.
Youtube : youtube.com/@mensascalper
Check out my profile for more useful indicators.
Introduction to Bitcoin Chart Analysis and Indicators.
Youtube : youtube.com/@mensascalper
Related publications
Disclaimer
The information and publications are not meant to be, and do not constitute, financial, investment, trading, or other types of advice or recommendations supplied or endorsed by TradingView. Read more in the Terms of Use.