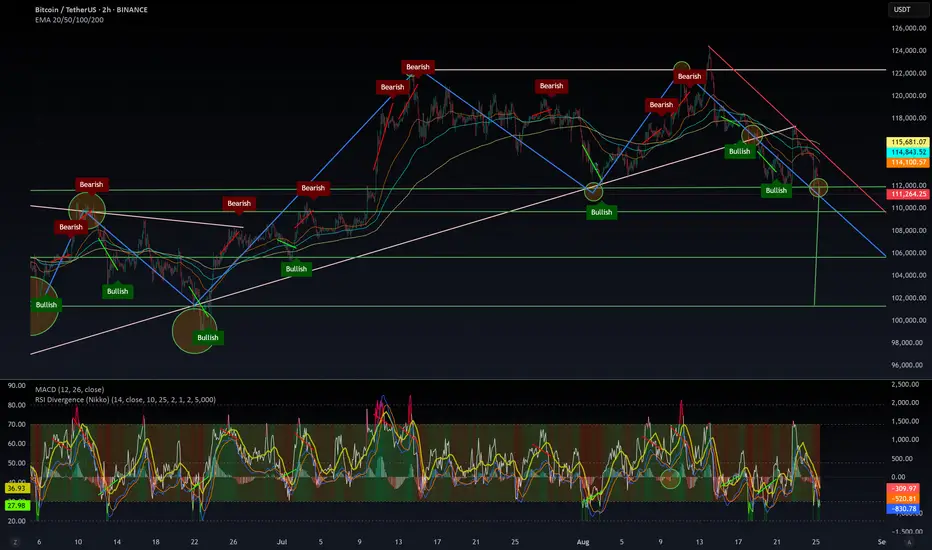
There are multiple support levels on the way down, so a bounce could happen at any of them. Ideally, this scenario gets invalidated with a strong rebound from $112K. Otherwise, the correction may drag on for weeks until a solid bottom is found.
The RSI is oversold on the 2H, but on the 1W timeframe,
⚠️ If the weekly bearish trend confirms, we could be facing several months of downside.
Will this trigger the start of alt season, or will altcoins get crushed even harder? Nobody can say for sure—so stay cautious and don’t get trapped by FOMO.
Here is the 1W chart, which is scary to be honest.
Telegram: t.me/metaisland_gg
Twitter X: x.com/cryptonikkoid
Web: nikkoid.com
I do not answer to private messages. Use the comment section of the idea or script, or use Telegram.
Twitter X: x.com/cryptonikkoid
Web: nikkoid.com
I do not answer to private messages. Use the comment section of the idea or script, or use Telegram.
Disclaimer
The information and publications are not meant to be, and do not constitute, financial, investment, trading, or other types of advice or recommendations supplied or endorsed by TradingView. Read more in the Terms of Use.