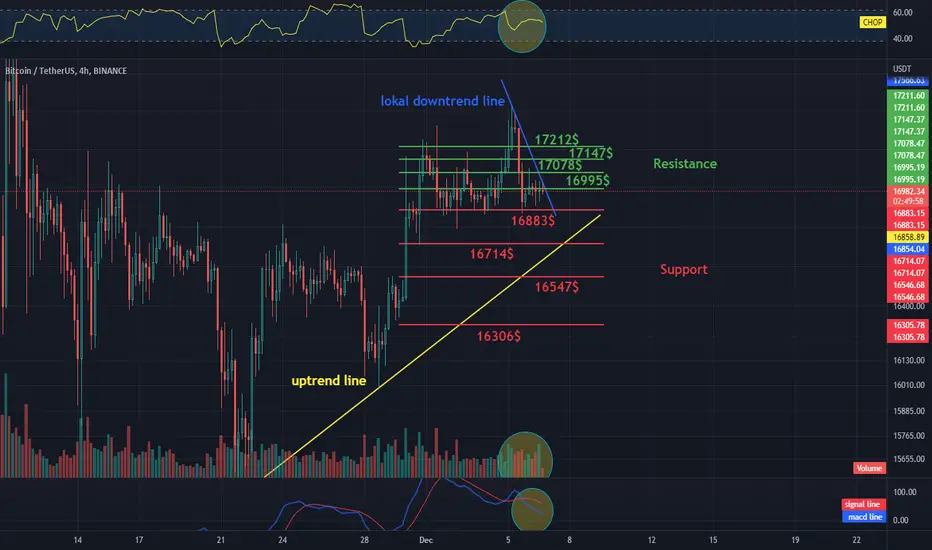
Hello everyone, let's look at the BTC to USDT chart on a 4-hour timeframe. As you can see, the price is moving above the uptrend line, but locally we are on the verge of the downtrend line.
Let's start with the support line and as you can see the first support in the near future is $16883, if the support is broken then the next support is $16714, $16547 and $16306.
Now let's move on to the resistance line, as you can see the first resistance the price is currently facing is $16995, if it breaks out the next resistance will be $17078, $17147 and $17212.
Looking at the CHOP indicator, we see that in the 4-hour interval we still have a lot of energy for the next move, the MACD indicator indicates a local downtrend, while the volume begins to indicate an advantage on the buyers' side.
Disclaimer
The information and publications are not meant to be, and do not constitute, financial, investment, trading, or other types of advice or recommendations supplied or endorsed by TradingView. Read more in the Terms of Use.
Disclaimer
The information and publications are not meant to be, and do not constitute, financial, investment, trading, or other types of advice or recommendations supplied or endorsed by TradingView. Read more in the Terms of Use.