#Bitcoin – Corrective Structure Developing
Current price: $110,350
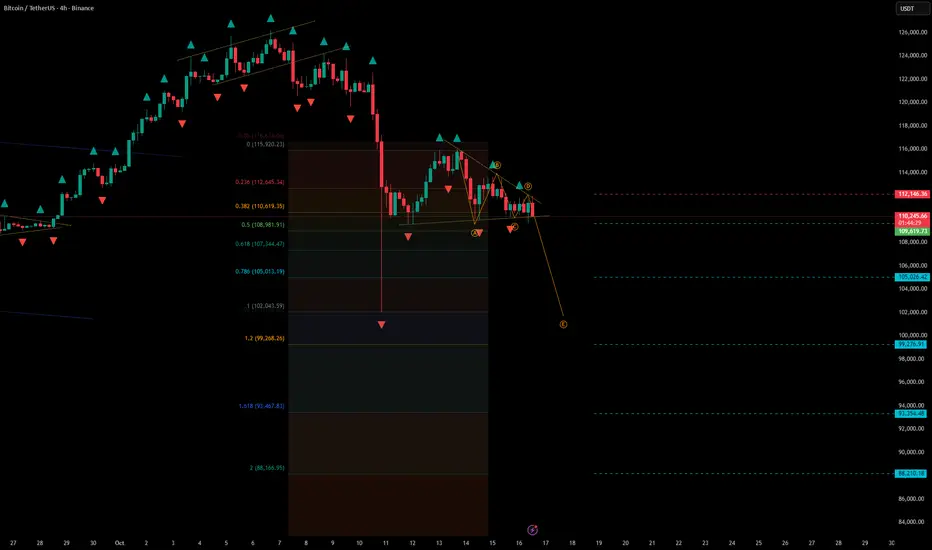
Bitcoin continues to trade inside a corrective structure, suggesting the market may be preparing for another downward leg before a potential recovery.
🧩 Technical Overview
• Price failed to hold above the $112,000 resistance zone and has since formed a descending pattern, likely part of an ABC correction.
• The local structure shows repeated lower highs and compression around $110,000, confirming seller control in the short term.
• The correction remains active while price stays below $112,000–$112,500.
📉 Scenario
• The market is forming a short-term bearish continuation pattern, with potential extension toward deeper Fibonacci supports.
• Stop-loss: above the $112,000 resistance zone.
• Downside zones to watch:
– $108,900–$107,300 — initial support area (0.5–0.618 Fib range)
– $105,000 — critical pivot zone
– $99,000–$100,000 — key Fibonacci cluster and potential short-term bottom
– $93,000–$88,000 — extended target range if pressure intensifies
⚙️ Market Context
• BTC remains in a corrective pullback phase following a strong September rally.
• Broader sentiment shows reduced risk appetite across crypto and macro assets.
• A sustained break below $105,000 could accelerate selling pressure, while recovery above $112,000 would invalidate the bearish scenario.
🧭 Summary
Bitcoin continues to consolidate within a corrective pattern, leaning bearish below $112,000.
Short-term momentum favors further downside toward $105,000–$99,000, with deeper extensions possible near $93,000–$88,000.
Until a breakout confirms otherwise, the bias remains cautiously bearish in the near term.
Current price: $110,350
Bitcoin continues to trade inside a corrective structure, suggesting the market may be preparing for another downward leg before a potential recovery.
🧩 Technical Overview
• Price failed to hold above the $112,000 resistance zone and has since formed a descending pattern, likely part of an ABC correction.
• The local structure shows repeated lower highs and compression around $110,000, confirming seller control in the short term.
• The correction remains active while price stays below $112,000–$112,500.
📉 Scenario
• The market is forming a short-term bearish continuation pattern, with potential extension toward deeper Fibonacci supports.
• Stop-loss: above the $112,000 resistance zone.
• Downside zones to watch:
– $108,900–$107,300 — initial support area (0.5–0.618 Fib range)
– $105,000 — critical pivot zone
– $99,000–$100,000 — key Fibonacci cluster and potential short-term bottom
– $93,000–$88,000 — extended target range if pressure intensifies
⚙️ Market Context
• BTC remains in a corrective pullback phase following a strong September rally.
• Broader sentiment shows reduced risk appetite across crypto and macro assets.
• A sustained break below $105,000 could accelerate selling pressure, while recovery above $112,000 would invalidate the bearish scenario.
🧭 Summary
Bitcoin continues to consolidate within a corrective pattern, leaning bearish below $112,000.
Short-term momentum favors further downside toward $105,000–$99,000, with deeper extensions possible near $93,000–$88,000.
Until a breakout confirms otherwise, the bias remains cautiously bearish in the near term.
Disclaimer
The information and publications are not meant to be, and do not constitute, financial, investment, trading, or other types of advice or recommendations supplied or endorsed by TradingView. Read more in the Terms of Use.
Disclaimer
The information and publications are not meant to be, and do not constitute, financial, investment, trading, or other types of advice or recommendations supplied or endorsed by TradingView. Read more in the Terms of Use.