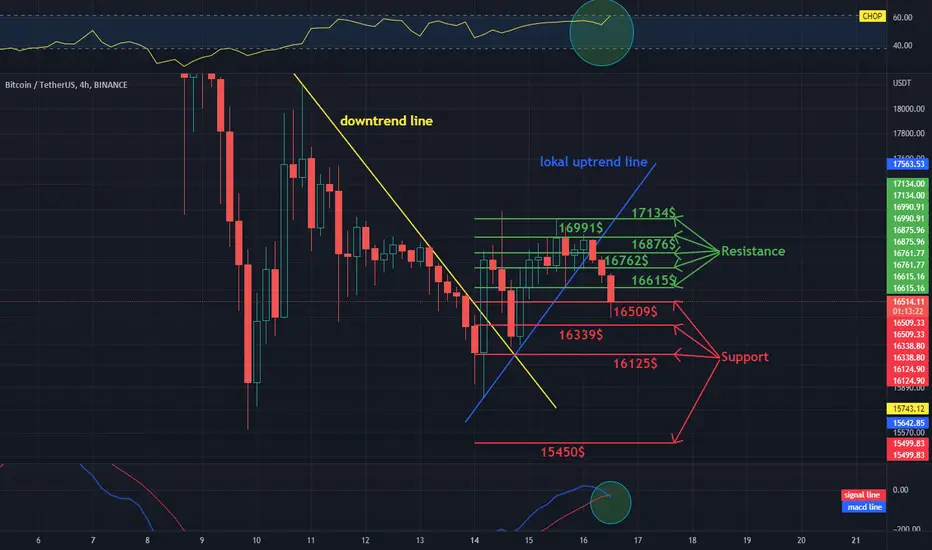
Hello everyone, let's look at the BTC to USDT chart on a 4-hour timeframe. As you can see, the price has moved above the downtrend line marked in yellow, however, we have now fallen below the local uptrend line.
Let's start with the support line and as you can see the first support at which the price is $16509, if the support is broken then the next support is $16339, $16125 and $15450.
Now let's go from the resistance line, as you can see the first resistance is $16615, if you manage to break it, the next resistance will be $16762, $16876, $16991 and $17134.
Looking at the CHOP indicator, we see that we have a lot of energy in the 4-hour interval, while the MACD indicator indicates that the blue line has crossed the red one from above, which confirms the local downtrend.
Disclaimer
The information and publications are not meant to be, and do not constitute, financial, investment, trading, or other types of advice or recommendations supplied or endorsed by TradingView. Read more in the Terms of Use.
Disclaimer
The information and publications are not meant to be, and do not constitute, financial, investment, trading, or other types of advice or recommendations supplied or endorsed by TradingView. Read more in the Terms of Use.