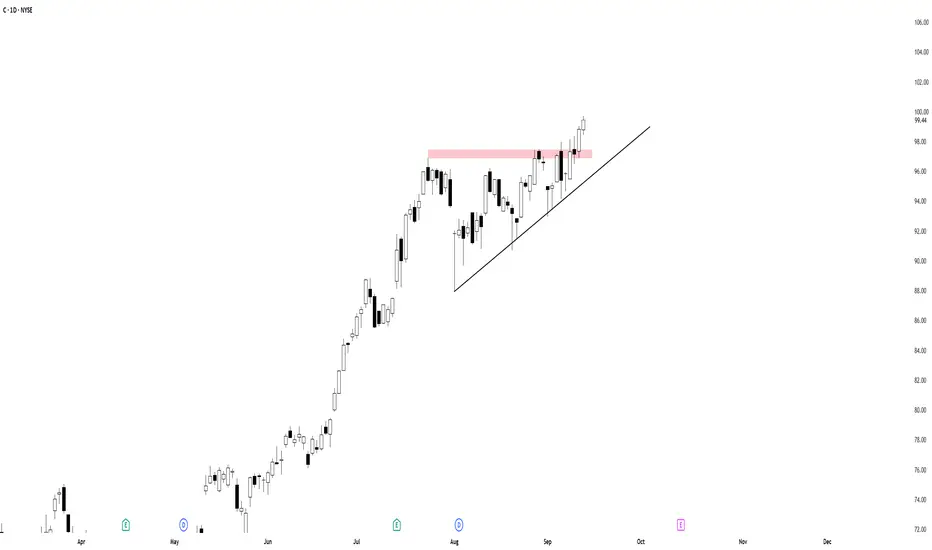
The price has broken out of an ascending triangle pattern formed between $95 and $98, showing strong follow-through. This breakout signals continuation of the prevailing uptrend.
Technical Setup: Clear series of higher lows, resistance around $97.50–$98 finally broken with a strong bullish candle.
Target: Measured move projects to around $106 ±0.5, based on the height of the triangle added to the breakout level.
Stop Loss: Immediate invalidation below $96.80 (breakout failure).
Alternative Exit: If the breakout shows soft weakness (limited follow-through, mild pullback), a wider stop can be placed under $95 (bottom of the triangle) to allow for a retest before resuming trend.
This structure suggests bullish continuation as long as price remains above the breakout zone. A retest of $97.50–$98 could offer a secondary entry opportunity.
Trade closed: target reached
Shinobi Trading Lab – Indicators • Stats • Discipline
👉 Patreon: patreon.com/ShinobiTradingLab
👉 Patreon: patreon.com/ShinobiTradingLab
Disclaimer
The information and publications are not meant to be, and do not constitute, financial, investment, trading, or other types of advice or recommendations supplied or endorsed by TradingView. Read more in the Terms of Use.