📝 Full Analysis
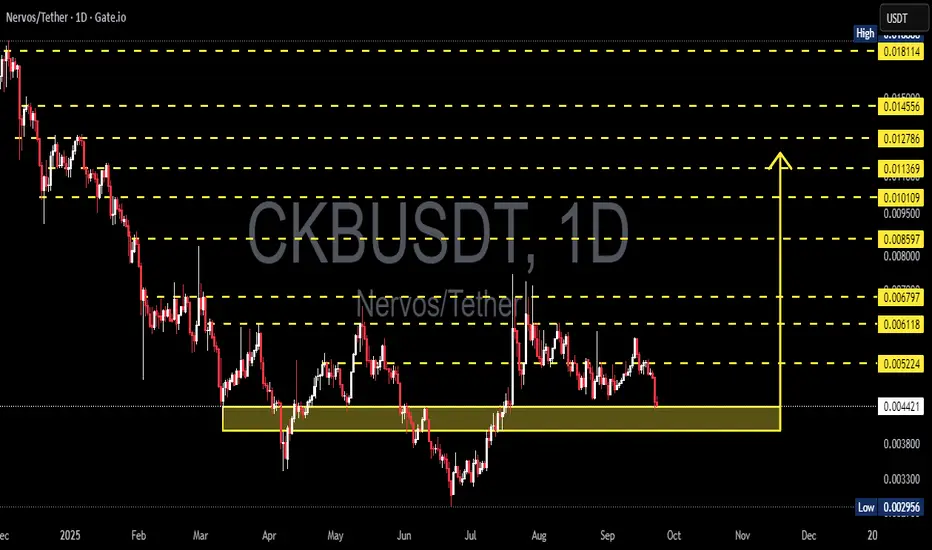
The Nervos (CKB/USDT) pair is now trading right inside a critical demand zone at 0.0038 – 0.0046. This area has repeatedly acted as a last line of defense against deeper declines. At this stage, the market is at a decision point: will this zone trigger another accumulation bounce, or will it finally give way to a stronger bearish continuation?
---
🔎 Price Structure & Pattern
1. Macro Trend
Since early 2025, CKB has remained in a major downtrend, printing consecutive lower highs and lower lows.
Every bullish attempt has been capped around key resistance clusters (yellow dashed lines).
2. Demand Zone (Yellow Box)
The 0.0038 – 0.0046 range has served as a strong base support.
Historically, buyers have stepped in whenever price dipped into this zone.
3. Key Resistance Levels (Upside Targets)
0.005224 → first minor resistance, key for early confirmation.
0.006118 → short-term target.
0.006797 → stronger psychological barrier.
0.008597 – 0.010109 → mid-term supply zone.
0.011369 – 0.018114 → long-term bullish targets if a major reversal takes place.
4. Key Support Levels (Downside Risks)
0.0038 → bottom of the demand zone.
0.002956 → previous major low.
A breakdown below this low could trigger a deeper bearish phase, exposing historical supports seen only on higher timeframes.
---
🚀 Bullish Scenario
Scenario A: Initial Bounce
If price holds above 0.0040–0.0044 and forms bullish reversal patterns (engulfing, hammer, or long-tail pinbar) with high volume, buyers may attempt a rebound.
Scenario B: Breakout Confirmation
A daily close above 0.005224 would shift the short-term structure bullish, paving the way toward 0.006118 – 0.006797.
Scenario C: Extended Rally
With strong momentum and volume, mid-term targets at 0.008597 – 0.0101 could be tested, which will act as a major test for a long-term reversal.
---
⚠️ Bearish Scenario
Scenario A: Breakdown of Demand
A daily close below 0.0038 invalidates the demand zone, signaling strong bearish continuation.
Scenario B: Downside Targets
The first target would be 0.002956 (previous low). A breakdown there could expose deeper historical supports below 0.0025.
Scenario C: Bull Trap / False Bounce
If price bounces off 0.0044 but fails to break above 0.005224 and reverses downward, it signals distribution and usually leads to an aggressive sell-off.
---
📊 Trading Plan (Example, Not Financial Advice)
Aggressive Strategy (Buy the Dip):
Entry near 0.0044, stop-loss below 0.0038.
Risk: ~14%
Target 1: 0.005224 (+17%)
Target 2: 0.006118 (+37%)
RR Ratio to Target 2 ≈ 2.6
Conservative Strategy (Wait for Breakout):
Entry after a daily close >0.005224 with valid retest.
Lower risk of false signal.
Targets extend toward 0.0068 and 0.0085.
Invalidation: All bullish bias is canceled if daily closes <0.0038.
---
🎯 Conclusion
At this stage, the 0.0038 – 0.0046 demand zone is the last stronghold for CKB.
If it holds, a rebound toward 0.0061–0.0068 is likely.
If it breaks, the market could quickly revisit 0.002956 or even lower.
In short, the price action in this zone will determine CKB’s mid-to-long term direction. Traders should closely watch volume and candlestick formations in the coming days to gauge whether buyers or sellers take control.
---
#CKB #CKBUSDT #Nervos #CryptoAnalysis #PriceAction #CryptoTA #SupportResistance #Altcoin #Breakout
✅ Get Free Signals! Join Our Telegram Channel Here: t.me/TheCryptoNuclear
✅ Twitter: twitter.com/crypto_nuclear
✅ Join Bybit : partner.bybit.com/b/nuclearvip
✅ Benefits : Lifetime Trading Fee Discount -50%
✅ Twitter: twitter.com/crypto_nuclear
✅ Join Bybit : partner.bybit.com/b/nuclearvip
✅ Benefits : Lifetime Trading Fee Discount -50%
Disclaimer
The information and publications are not meant to be, and do not constitute, financial, investment, trading, or other types of advice or recommendations supplied or endorsed by TradingView. Read more in the Terms of Use.