WTI OIL This is what separates a drop to $49 from a rally to $68WTI Crude Oil (USOIL) remains within its 2-year Channel Down since the September 25 2023 High, as well within a 'smaller' one (blue) since late July 2025.
What separates right now the market from a continuation of the latter's Channel Down downtrend and a rebound towards the long ones 1W MA100 (green trend-line), is the 8-month Support level of 55.20.
As you can see, this has recently held (week of December 15 2025) for the 3rd time since April 2025. However the 1D MA50 (red trend-line) keeps rejecting any 1W candle, maintaining the bearish trend of the (blue) Channel Down.
If it breaks and the market closes 2 straight 1W candles above it (1D MA50), then we expect a 2-3 month rally to test the 1W MA100 and the 0.618 Fibonacci level (like all previous Bullish Legs within the 2-year Channel Down did) at $68.00.
If on the other hand the market closes a 1W candle below the 8-month Support (55.20), we expect the continuation of the bearish trend until the 1W RSI touches its long-term Support Zone again. An early estimated Target on his is $49.00 but best to take profit when the 1W RSI this the Support Zone regardless of the price, as it has marked the last two major market bottoms (Lower Lows).
---
** Please LIKE 👍, FOLLOW ✅, SHARE 🙌 and COMMENT ✍ if you enjoy this idea! Also share your ideas and charts in the comments section below! This is best way to keep it relevant, support us, keep the content here free and allow the idea to reach as many people as possible. **
---
💸💸💸💸💸💸
👇 👇 👇 👇 👇 👇
Cl1

Crude to $75 Profit TargetYou all know I'm a 100% Chart driven trader.
But of course I also have my fundamental thoughts.
Here is my layman’s fundamental thesis:
I do not believe that Venezuelan oil will flood global markets, just because they grabed Maduro. On the contrary, the opposite is more likely. Venezuela’s production is dominated by heavy and extra-heavy crude, which is costly to extract and difficult to refine. As a result, an oversupplied market is unlikely from this point of view.
But with a U.S. military invasion of Iran could be very likely to drive oil prices higher, potentially sharply so. The effect would stem from supply risk, transportation chokepoints, and market psychology I think. Even if physical supply disruptions were initially limited. My experience is, that short-term crazy price moves are often driven by psychological factors.
So, in short:
1. Risk to the Strait of Hormuz (Primary Factor)
2. Potential loss or Threat of Iranian Oil Supply
3. Spillover Risk to Other Producers
4. Speculation and Financial Market Reaction
5. OPEC and Strategic Reserves Probably Very Limited
Sure, the magnitude would depend on duration, scope, and whether shipping through Hormuz remains uninterrupted, but upward price pressure would be immediate.
Timing is always the most difficult part. That’s why I would look at a trade with a horizon of at least three months, or longer (likely using ITM LEAP options).
The chart needs to confirm my thesis.
First, I want to see a break of the descending pressure line (red).
Next, the CIB line must be broken.
Finally, a sign of stabilization above the CIB line would serve as my entry signal.
That’s it. My stalker hat is on.

WTI OIL Strong case for a 2-month rally.WTI Oil (USOIL) has been trading within a Channel Down since the September 28 2023 High. Since then, it as had four Bearish Legs (including the current one), which declined on a range of -25.62% to -31.58%. All subsequent rebounds (Bullish Legs) that followed, hit at least their 0.681 Fibonacci retracement levels.
Given that the price rebounded 2 weeks ago on the 8-month Support (55.20) and the 1W RSI has been on Higher Lows (i.e. Bullish Divergence) since May, we may see a new Bullish Leg emerging now.
The one condition that will confirm that will be the price breaking above the blue Channel Down. If that takes place, we will turn bullish for the next two months, targeting $69.00 (Fib 0.618).
---
** Please LIKE 👍, FOLLOW ✅, SHARE 🙌 and COMMENT ✍ if you enjoy this idea! Also share your ideas and charts in the comments section below! This is best way to keep it relevant, support us, keep the content here free and allow the idea to reach as many people as possible. **
---
💸💸💸💸💸💸
👇 👇 👇 👇 👇 👇

CRUDE OIL (CL) PREDICTIONCRUDE OIL (CL) PREDICTION
📊 Market Sentiment
Crude oil prices had been trending lower following signs of de-escalation in the Israel–Palestine conflict, easing tensions with Iran, and emerging peace signals from the Russia–Ukraine front.
However, recent statements from Trump and the possibility of a U.S. military action against Venezuela have shifted sentiment back to the upside.
Venezuela holds approximately 18% of the world’s proven oil reserves and ranks as the 12th largest oil producer globally. Any potential conflict involving the U.S. could significantly disrupt supply expectations, acting as a strong bullish catalyst for oil prices.
📈 Technical Analysis
CL swept monthly liquidity around the $55 level and has since shifted into a bullish structure on the daily timeframe.
In my view, this move indicates that price has gathered sufficient energy for either continuation higher or a controlled retracement before the next bullish leg.
📌 Prediction – Game Plan
I entered a long position at 56.24$.
🎯 TP1: 57.70$
I will take partial profits here and move the remaining position to breakeven.
🎯 TP2: 58.90$
🛑 Stop Loss: Daily close below 55.40$
💬 For deeper sentiment and strategy insights, subscribe to my Substack free access available.
This analysis is for educational purposes only and does not constitute financial advice. Always conduct your own research before trading or investing.

WTI OIL on its 1D MA50 again. Sell signal.Last week (December 17, see chart below) we gave a strong Buy Signal on WTI Crude Oil (USOIL) after it hit and rebounded on the 8-month Support.
The resulting rally easily hit our $58.50 Target and today the price tests the 1D MA50 (blue trend-line) for the first time since the previous Lower High of the 5-month Channel Down. This is an automatic technical Sell Signal as at the same time the 1D RSI is reversing near its 4-month Resistance Zone.
Our short-term Target is again the $55.20 Support.
---
** Please LIKE 👍, FOLLOW ✅, SHARE 🙌 and COMMENT ✍ if you enjoy this idea! Also share your ideas and charts in the comments section below! This is best way to keep it relevant, support us, keep the content here free and allow the idea to reach as many people as possible. **
---
💸💸💸💸💸💸
👇 👇 👇 👇 👇 👇

USO - In Symmetrical triangle consolidation since 2022USO - In Symmetrical triangle consolidation since 2022.
Has broken out of a prior decade long term downtrend.
After such a long period of three years in consolidation, next move likely to be steep, and volatility will likely pick up.

Buyers Step Into WTI Crude OilGiven the high-volume buy bar around a decent support cluster, WTI could be set to mean revert higher.
Matt Simpson, Market Analyst at City Index.

WTI OIL Time to buy the 8-month Support.Last week (December 9, see chart below), we gave a strong Sell Signal on WTI Oil (USOIL) as the 1-month Channel Down topped and started its new Bearish Leg, which eventually hit our $56.20 Target:
This time we move back to the 1D time-frame as the longer term dynamics are coming into place again. The key development now is that the price hit yesterday the 55.20 8-month Support (holding since April 09 2025) and today bounced.
This rebound has high probabilities of being a sustainable one, especially since the 1D RSI also bounced from inside its own Support Zone.
Based on the 6-month Channel Down, the immediate Resistance level, thus our short-term Target is the 1D MA50 (blue trend-line). We estimate that the price can make contact with it at $58.50.
---
** Please LIKE 👍, FOLLOW ✅, SHARE 🙌 and COMMENT ✍ if you enjoy this idea! Also share your ideas and charts in the comments section below! This is best way to keep it relevant, support us, keep the content here free and allow the idea to reach as many people as possible. **
---
💸💸💸💸💸💸
👇 👇 👇 👇 👇 👇


Will this be the final Defense from BUYERS to LIFT Crude ?NYMEX:CL1!
Becoming Profitable in the Auction, is a choice only chosen by the 'PROFITABLE'...
As of December 14, 2025, the (front-month) WTI crude oil futures contract (CL1) has declined by approximately 18% to 20% this year (year-to-date). Now currently we have a Daily Demand zone that ranges from $57.00-$55.00 p/b, will this be the final defense from buyers to lift the offer higher here in the auction or will sellers over power and tank the auction lower? There has been gr8 talks in the Energy Markets that Crude OIL is expected to go into a strong BULL MARKET PHASE starting 2026, what are your thoughts? Lmk in the comments...
Continued Success,
TreyHighPwr
#BHM500K

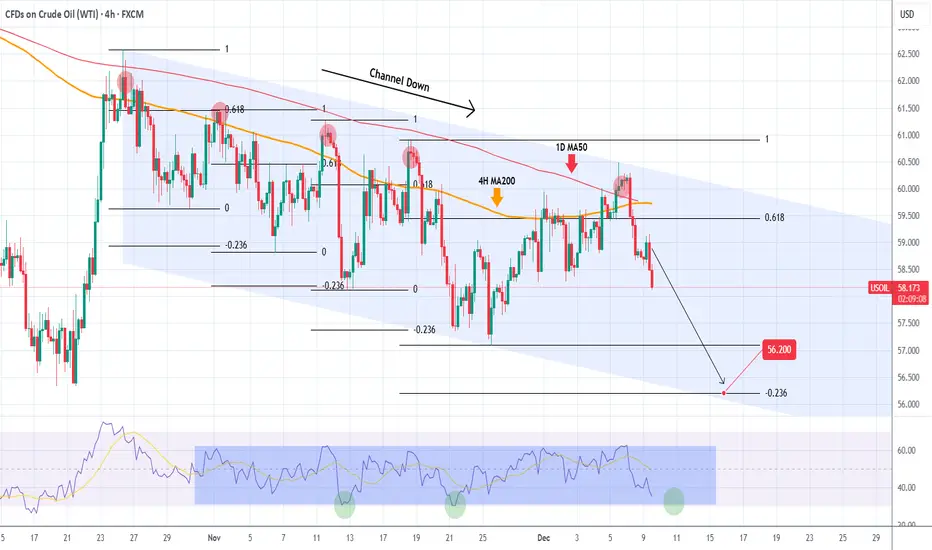
WTI OIL 1.5 month Channel Down started new Bearish Leg.WTI Oil (USOIL) has been trading within a 1.5-month Channel Down (since the October 4 High), that priced last Friday its latest Lower High, this time above the 1D MA50 (red trend-line).
That initiated the new Bearish Leg (also confirmed by the 4H RSI rejection at the top of its range). All 4 previous Bearish Legs bottomed just when the hit the -0.236 Fibonacci extension.
Based on that, we are expecting WTI to make a new Lower Low at 56.200.
---
** Please LIKE 👍, FOLLOW ✅, SHARE 🙌 and COMMENT ✍ if you enjoy this idea! Also share your ideas and charts in the comments section below! This is best way to keep it relevant, support us, keep the content here free and allow the idea to reach as many people as possible. **
---
💸💸💸💸💸💸
👇 👇 👇 👇 👇 👇
WTI OIL targeting at least $56.00 on the short-term.WTI Oil (USOIL) continues to expand its 4-month Channel Down and has repeatedly been rejected on its 1D MA50 (blue trend-line) in the past 40 days.
As mentioned before, this is similar to September's price action, which eventually tested the previous Support before breaking it and move to a new Lower Low on the 1.5 Fibonacci extension.
As a result, we are still expecting to see $56.00 on the short-term.
---
** Please LIKE 👍, FOLLOW ✅, SHARE 🙌 and COMMENT ✍ if you enjoy this idea! Also share your ideas and charts in the comments section below! This is best way to keep it relevant, support us, keep the content here free and allow the idea to reach as many people as possible. **
---
💸💸💸💸💸💸
👇 👇 👇 👇 👇 👇

CL1! — Bullish Above 58 with Target at 62.22Crude oil maintains a constructive bullish structure as long as price holds above the 58.00 key support zone. This level remains the foundation of the current upward bias.
The next meaningful obstacle for buyers sits at the 60.69 resistance, which aligns with a major Fibonacci cluster and has shown strong rejection in previous attempts. A clean breakout and sustained close above 60.69 would confirm renewed bullish momentum.
Above that resistance, the path opens toward 61.71 followed by the main upside target at 62.22, which represents the completion of the current Fibonacci expansion.
As long as price trades above 58, the bullish scenario remains valid. A failure at 60.69 may trigger a temporary pullback, but the broader structure favors continuation toward 62.22 once the level is cleared.

WTI OIL Short-term relief rebound before a Lower Low?WTI Oil (USOIL) has been trading within a 1-month Channel Down and has just completed its strongest Bearish Leg (-5.91%). All previous three Bearish Legs eventually bottomed and rebounded into the new Bullish Legs towards the Sell Zone consisting of the 4H MA200 (orange trend-line) - 1D MA50 (red trend-line) range to form a new Lower High.
In 2 out of those 3 cases, it even exceeded the 0.618 Fibonacci retracement level. As a result, we expect a short-term rise now to subsequently be sold towards the -0.236 Fibonacci extension. Our medium-term Target remains 56.500.
---
** Please LIKE 👍, FOLLOW ✅, SHARE 🙌 and COMMENT ✍ if you enjoy this idea! Also share your ideas and charts in the comments section below! This is best way to keep it relevant, support us, keep the content here free and allow the idea to reach as many people as possible. **
---
💸💸💸💸💸💸
👇 👇 👇 👇 👇 👇

Light crude oil On oil, I like two levels for trade, one is short from the approximate price of 66.3, where a deviation above the high could be created, and the close fibo level of 0.5 adds to the confluence, and the daily level on the long, I would like a drop at least below the value low around the price level of 57.46, where the daily level is also nearby

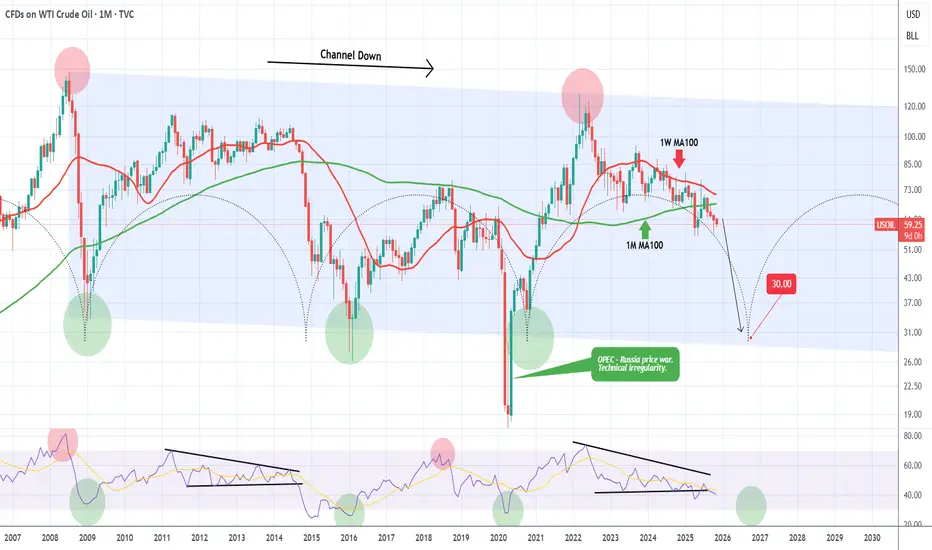
WTI OIL Is it possible to crash at $30.00?WTI Oil (USOIL) has been declining for 3 straight months (current red 1M candle is the 4th one) since the June 2025 rejection on the 1W MA100 (red trend-line). That has been the last rejection of a series of Lower Highs rejections on the 1W MA100 in the past 2 years.
On the much longer-term scale, this is the aftermath of the March 2022 market Top, made as a direct result of the Ukraine - Russia war. On a 17-year horizon, that was the 2nd Lower High of the multi-year Channel Down that WTI has been trading in since the July 2008 Top of the Housing Crisis.
As you can see, there is a high degree of symmetry on this pattern with Lower Lows in particular (market bottoms) getting formed around every 5-6 years. The use of the Time Cycles can fairly accurately project this. The next one is estimated to be towards the end of 2026, which matches perfectly the projected Bear Cycle bottom on the stock markets.
Based on this model, we may very well see WTI drop to as low as $30.00. A fairly solid bottom buy indicator would be when (if) the 1M RSI breaks below its 30.00 (oversold) barrier.
---
** Please LIKE 👍, FOLLOW ✅, SHARE 🙌 and COMMENT ✍ if you enjoy this idea! Also share your ideas and charts in the comments section below! This is best way to keep it relevant, support us, keep the content here free and allow the idea to reach as many people as possible. **
---
💸💸💸💸💸💸
👇 👇 👇 👇 👇 👇
WTI OIL Successive 1D MA50 rejections. Sell Signal.WTI Oil (USOIL) has been trading within a 3-month Channel Down with the price experiencing successive rejection on the 1D MA50 (blue trend-line) since the October 24 Lower High.
Given that the 0.5 Fibonacci retracement level was also filled (as on the previous Lower High), we expect this inability to break above, to kickstart the new Bearish Leg.
As previously, the Target is the Support at $56.00.
---
** Please LIKE 👍, FOLLOW ✅, SHARE 🙌 and COMMENT ✍ if you enjoy this idea! Also share your ideas and charts in the comments section below! This is best way to keep it relevant, support us, keep the content here free and allow the idea to reach as many people as possible. **
---
💸💸💸💸💸💸
👇 👇 👇 👇 👇 👇

WTI OIL 4H Channel Down aiming for a Lower Low.WTI Oil (USOIL) is extending the 1D MA50 (red trend-line) rejection of October 24 and has formed a short-term Channel Down. We are currently on its second Bearish Leg following a new rejection this time on the 4H MA200 (orange trend-line).
With the first Bearish Leg declining by -4.72%, we expect the current one to replicate this drop and target $58.60.
-------------------------------------------------------------------------------
** Please LIKE 👍, FOLLOW ✅, SHARE 🙌 and COMMENT ✍ if you enjoy this idea! Also share your ideas and charts in the comments section below! This is best way to keep it relevant, support us, keep the content here free and allow the idea to reach as many people as possible. **
-------------------------------------------------------------------------------
💸💸💸💸💸💸
👇 👇 👇 👇 👇 👇

BUY USOILOur trade for today is on OIL, as you can see, we bought to target the Daily LQ.
Follow for more trades!

WTI Crud Oil Holds Above $60Crude oil closed higher for a third day on Friday and is showing signs of stability above $60. This suggests the retracement from 62.59 is complete and momentum is preparing to realign itself with the rally from the 55.96 low.
While resistance is nearby - from the 200-day EMA and October's high-volume node (HVN), I suspect prices will eventually break above them. Bulls could consider dips towards last week's low to increase the potential reward to risk ratio, on the assumption of a retest of the 62.59 high and potential break above it.
Matt Simpson, Market Analyst at City Index

Gold | Oil | Dollar | Silver | Natural Gas Price ForecastGold | Oil | Dollar | Silver | Natural Gas Price Forecast
NYMEX:NG1! COMEX:GC1! COMEX:SI1! AMEX:UNG

WTI OIL 1D MA50 rejection. Sell Signal.Last time (October 14, see chart below) we took a look on WTI Oil (USOIL), we gave a Buy Signal right at the bottom of its 3-month Channel Down, which eventually hit our 62.00 Target:
This time we have a Sell Signal as the price and the Channel's Bullish Leg got rejected on its 1D MA50 (blue trend-line). When that happened in September, the market started to decline and reached its lower Support.
As a result, we expect Oil to turn bearish here, targeting $56.00.
-------------------------------------------------------------------------------
** Please LIKE 👍, FOLLOW ✅, SHARE 🙌 and COMMENT ✍ if you enjoy this idea! Also share your ideas and charts in the comments section below! This is best way to keep it relevant, support us, keep the content here free and allow the idea to reach as many people as possible. **
-------------------------------------------------------------------------------
💸💸💸💸💸💸
👇 👇 👇 👇 👇 👇

Crude Oil is InflationOne of the best ways to gauge where inflation is heading is by tracking the relationship between crude oil prices and the U.S. Consumer Price Index (CPI).
If we take a moment to observe their movement from the 1980s to today, we can see that they have generally moved in tandem. The year of their peaks and troughs are in synchronization.
So, who is leading whom?
Is it the inflation data that drive crude oil prices higher or lower — or is it crude oil prices that influence the inflation trend?
WTI Crude Oil Futures & Options
Ticker: MCL
Minimum fluctuation:
0.01 per barrel = $1.00
Disclaimer:
• What presented here is not a recommendation, please consult your licensed broker.
• Our mission is to create lateral thinking skills for every investor and trader, knowing when to take a calculated risk with market uncertainty and a bolder risk when opportunity arises.
CME Real-time Market Data help identify trading set-ups in real-time and express my market views. If you have futures in your trading portfolio, you can check out on CME Group data plans available that suit your trading needs www.tradingview.com
