Cisco  CSCO hit a 25-1/2-year high the other day, with the tech giant up some 20% year to date -- beating a 16% gain for the S&P 500
  SPX during the same period. Let's see what CSCO's technical and fundamental analysis says as the firm prepares to release quarterly results this week.
Cisco's Fundamental Analysis
Once an old-school networking company, Cisco has been trying to turn itself of late into a new-school networking/optics solutions/security-tech giant.
Its shares rose early last week to $74.84 -- Cisco's highest price since April 2000 -- after the firm announced the launch of a new "Unified Edge" platform.
Unified Edge aims to address capacity constraints related to agentic and generative artificial intelligence as Cisco focuses on its latest business, Contact Center and Platform as a Service software (or CPaaS).
Meanwhile, Cisco plans to release fiscal Q1 results after the closing bell Wednesday, with the Street looking for $0.98 in adjusted earnings per share on roughly $14.8 billion of revenue.
That would represent a 7.7% gain from the $0.91 in adjusted EPS that Cisco recorded in the year-ago period, plus roughly 7% growth from the $13.8 billion quarterly revenue recorded 12 months ago.
Thirteen of the 20 sell-side analysts that I know of who cover Cisco have revised their earnings estimates higher since the quarter began, while two have cut their numbers. (Five analysts have made no changes.)
Cisco's Technical Analysis
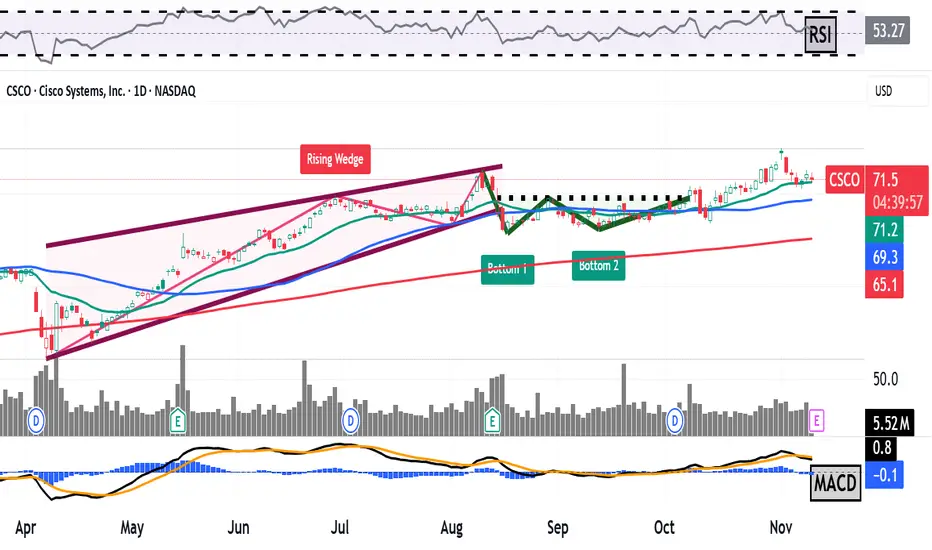
Now let's take a look at CSCO's chart going back some seven months and running through Thursday afternoon:

Readers will first note that Cisco rallied into a rising-wedge pattern of bearish reversal from April into August, as marked with a red box, two diagonal lines and pink shading at the chart's left.
The stock then broke down from that pattern, but caught itself over the late summer and put in a double-bottom pattern of bullish reversal, as denoted with green boxes and diagonal green lines at the chart's right. This pattern has a $70 pivot.
Since then, CSCO rallied into October (as almost all tech stocks did), but has since run into some turbulence.
Still, Cisco has enjoyed some support at its 21-day Exponential Moving Average (or "EMA," marked with a green line above). This likely came from the swing-trading crowd.
As a result, Cisco's 50-day Simple Moving Average (or "SMA," denoted with a blue line), hasn't come under fire since early October. Incidentally, 50-day SMA is often where many portfolio managers focus with a stock.
As for Cisco's secondary technical indicators, the stock's Relative Strength Index (the gray line at the chart's top) is close to neutral and appears to be losing some steam.
Similarly, Cisco's daily Moving Average Convergence Divergence indicator (or "MACD," denoted by black and gold lines and blue bars at the chart's bottom) is sending mixed messages -- or maybe even a non-message overall.
The histogram of Cisco's 9-day EMA (the blue bars) is resting close to zero after having been in positive territory for some time.
Meanwhile, the 12-day EMA (the black line) has run into the 26-day EMA (the gold line) after having been riding higher for weeks. These are neither bullish nor bearish technical signals.
All in, CSCO's recent high near $75 looks like the stock's upside pivot, while Cisco's 50-day SMA (the blue line at $69.20 in the chart above) likely represents its downside pivot.
An Options Option
An options trader who's willing to get long or short on Cisco but hopes to possibly get paid to do so might use a strategy known as a "strangle."
That's where the trader forecasts a decrease in volatility and isn't especially interested in which direction the stock moves.
In this case, the trader is fine with getting paid to do nothing should the stock stagnate through the option's expiration, which might happen given that Cisco's technical indicators are rather neutral.
Alternatively, the trader might end up getting long CSCO at a discount or short at a premium depending on what the stock does by the strangle's expiration date.
Here's an example using Cisco's recent price of around $71.50:
-- Sell (write) one CSCO $70 put with a Nov. 14 expiration (i.e., after Wednesday's earnings release). This put carried about a $1.50 price at recent trading levels.
-- Sell (write) one CSCO Nov. 14 $73 call for roughly $1.45.
Net Credit: $2.95.
Should CSCO remain between the two options' strike prices through expiration, the trader would pocket the entire $2.95 credit.
However, should the stock trade above $73 at expiration, the trader would end up short 100 shares at a $75.95 net basis.
And should CSCO trade below $70 at expiration, the trader would wind up long 100 shares at a $67.05 net basis.
That said, investors should understand that although Cisco isn't historically an especially volatile stock, the hypothetical loss here is extreme. After all, any stock can theoretically fall to zero -- or in the other direction, go to the moon.
(Moomoo Technologies Inc. Markets Commentator Stephen "Sarge" Guilfoyle had no position in CSCO at the time of writing this column.)
This article discusses technical analysis, other approaches, including fundamental analysis, may offer very different views. The examples provided are for illustrative purposes only and are not intended to be reflective of the results you can expect to achieve. Specific security charts used are for illustrative purposes only and are not a recommendation, offer to sell, or a solicitation of an offer to buy any security. Past investment performance does not indicate or guarantee future success. Returns will vary, and all investments carry risks, including loss of principal. This content is also not a research report and is not intended to serve as the basis for any investment decision. The information contained in this article does not purport to be a complete description of the securities, markets, or developments referred to in this material. Moomoo and its affiliates make no representation or warranty as to the article's adequacy, completeness, accuracy or timeliness for any particular purpose of the above content. Furthermore, there is no guarantee that any statements, estimates, price targets, opinions or forecasts provided herein will prove to be correct.
Options trading is risky and not appropriate for everyone. Read the Options Disclosure Document (https://j.moomoo.com/017y9J) before trading. Options are complex and you may quickly lose the entire investment. Supporting docs for any claims will be furnished upon request.
Options trading subject to eligibility requirements. Strategies available will depend on options level approved.
Maximum potential loss and profit for options are calculated based on the single leg or an entire multi-leg trade remaining intact until expiration with no option contracts being exercised or assigned. These figures do not account for a portion of a multi-leg strategy being changed or removed or the trader assuming a short or long position in the underlying stock at or before expiration. Therefore, it is possible to lose more than the theoretical max loss of a strategy.
Moomoo is a financial information and trading app offered by Moomoo Technologies Inc. In the U.S., investment products and services on Moomoo are offered by Moomoo Financial Inc., Member FINRA/SIPC.
TradingView is an independent third party not affiliated with Moomoo Financial Inc., Moomoo Technologies Inc., or its affiliates. Moomoo Financial Inc. and its affiliates do not endorse, represent or warrant the completeness and accuracy of the data and information available on the TradingView platform and are not responsible for any services provided by the third-party platform.
Cisco's Fundamental Analysis
Once an old-school networking company, Cisco has been trying to turn itself of late into a new-school networking/optics solutions/security-tech giant.
Its shares rose early last week to $74.84 -- Cisco's highest price since April 2000 -- after the firm announced the launch of a new "Unified Edge" platform.
Unified Edge aims to address capacity constraints related to agentic and generative artificial intelligence as Cisco focuses on its latest business, Contact Center and Platform as a Service software (or CPaaS).
Meanwhile, Cisco plans to release fiscal Q1 results after the closing bell Wednesday, with the Street looking for $0.98 in adjusted earnings per share on roughly $14.8 billion of revenue.
That would represent a 7.7% gain from the $0.91 in adjusted EPS that Cisco recorded in the year-ago period, plus roughly 7% growth from the $13.8 billion quarterly revenue recorded 12 months ago.
Thirteen of the 20 sell-side analysts that I know of who cover Cisco have revised their earnings estimates higher since the quarter began, while two have cut their numbers. (Five analysts have made no changes.)
Cisco's Technical Analysis
Now let's take a look at CSCO's chart going back some seven months and running through Thursday afternoon:
Readers will first note that Cisco rallied into a rising-wedge pattern of bearish reversal from April into August, as marked with a red box, two diagonal lines and pink shading at the chart's left.
The stock then broke down from that pattern, but caught itself over the late summer and put in a double-bottom pattern of bullish reversal, as denoted with green boxes and diagonal green lines at the chart's right. This pattern has a $70 pivot.
Since then, CSCO rallied into October (as almost all tech stocks did), but has since run into some turbulence.
Still, Cisco has enjoyed some support at its 21-day Exponential Moving Average (or "EMA," marked with a green line above). This likely came from the swing-trading crowd.
As a result, Cisco's 50-day Simple Moving Average (or "SMA," denoted with a blue line), hasn't come under fire since early October. Incidentally, 50-day SMA is often where many portfolio managers focus with a stock.
As for Cisco's secondary technical indicators, the stock's Relative Strength Index (the gray line at the chart's top) is close to neutral and appears to be losing some steam.
Similarly, Cisco's daily Moving Average Convergence Divergence indicator (or "MACD," denoted by black and gold lines and blue bars at the chart's bottom) is sending mixed messages -- or maybe even a non-message overall.
The histogram of Cisco's 9-day EMA (the blue bars) is resting close to zero after having been in positive territory for some time.
Meanwhile, the 12-day EMA (the black line) has run into the 26-day EMA (the gold line) after having been riding higher for weeks. These are neither bullish nor bearish technical signals.
All in, CSCO's recent high near $75 looks like the stock's upside pivot, while Cisco's 50-day SMA (the blue line at $69.20 in the chart above) likely represents its downside pivot.
An Options Option
An options trader who's willing to get long or short on Cisco but hopes to possibly get paid to do so might use a strategy known as a "strangle."
That's where the trader forecasts a decrease in volatility and isn't especially interested in which direction the stock moves.
In this case, the trader is fine with getting paid to do nothing should the stock stagnate through the option's expiration, which might happen given that Cisco's technical indicators are rather neutral.
Alternatively, the trader might end up getting long CSCO at a discount or short at a premium depending on what the stock does by the strangle's expiration date.
Here's an example using Cisco's recent price of around $71.50:
-- Sell (write) one CSCO $70 put with a Nov. 14 expiration (i.e., after Wednesday's earnings release). This put carried about a $1.50 price at recent trading levels.
-- Sell (write) one CSCO Nov. 14 $73 call for roughly $1.45.
Net Credit: $2.95.
Should CSCO remain between the two options' strike prices through expiration, the trader would pocket the entire $2.95 credit.
However, should the stock trade above $73 at expiration, the trader would end up short 100 shares at a $75.95 net basis.
And should CSCO trade below $70 at expiration, the trader would wind up long 100 shares at a $67.05 net basis.
That said, investors should understand that although Cisco isn't historically an especially volatile stock, the hypothetical loss here is extreme. After all, any stock can theoretically fall to zero -- or in the other direction, go to the moon.
(Moomoo Technologies Inc. Markets Commentator Stephen "Sarge" Guilfoyle had no position in CSCO at the time of writing this column.)
This article discusses technical analysis, other approaches, including fundamental analysis, may offer very different views. The examples provided are for illustrative purposes only and are not intended to be reflective of the results you can expect to achieve. Specific security charts used are for illustrative purposes only and are not a recommendation, offer to sell, or a solicitation of an offer to buy any security. Past investment performance does not indicate or guarantee future success. Returns will vary, and all investments carry risks, including loss of principal. This content is also not a research report and is not intended to serve as the basis for any investment decision. The information contained in this article does not purport to be a complete description of the securities, markets, or developments referred to in this material. Moomoo and its affiliates make no representation or warranty as to the article's adequacy, completeness, accuracy or timeliness for any particular purpose of the above content. Furthermore, there is no guarantee that any statements, estimates, price targets, opinions or forecasts provided herein will prove to be correct.
Options trading is risky and not appropriate for everyone. Read the Options Disclosure Document (https://j.moomoo.com/017y9J) before trading. Options are complex and you may quickly lose the entire investment. Supporting docs for any claims will be furnished upon request.
Options trading subject to eligibility requirements. Strategies available will depend on options level approved.
Maximum potential loss and profit for options are calculated based on the single leg or an entire multi-leg trade remaining intact until expiration with no option contracts being exercised or assigned. These figures do not account for a portion of a multi-leg strategy being changed or removed or the trader assuming a short or long position in the underlying stock at or before expiration. Therefore, it is possible to lose more than the theoretical max loss of a strategy.
Moomoo is a financial information and trading app offered by Moomoo Technologies Inc. In the U.S., investment products and services on Moomoo are offered by Moomoo Financial Inc., Member FINRA/SIPC.
TradingView is an independent third party not affiliated with Moomoo Financial Inc., Moomoo Technologies Inc., or its affiliates. Moomoo Financial Inc. and its affiliates do not endorse, represent or warrant the completeness and accuracy of the data and information available on the TradingView platform and are not responsible for any services provided by the third-party platform.
Disclaimer
The information and publications are not meant to be, and do not constitute, financial, investment, trading, or other types of advice or recommendations supplied or endorsed by TradingView. Read more in the Terms of Use.
Disclaimer
The information and publications are not meant to be, and do not constitute, financial, investment, trading, or other types of advice or recommendations supplied or endorsed by TradingView. Read more in the Terms of Use.