🔹U.S. Dollar Index (DXY) – 4H Chart Analysis
▪Market Structure:
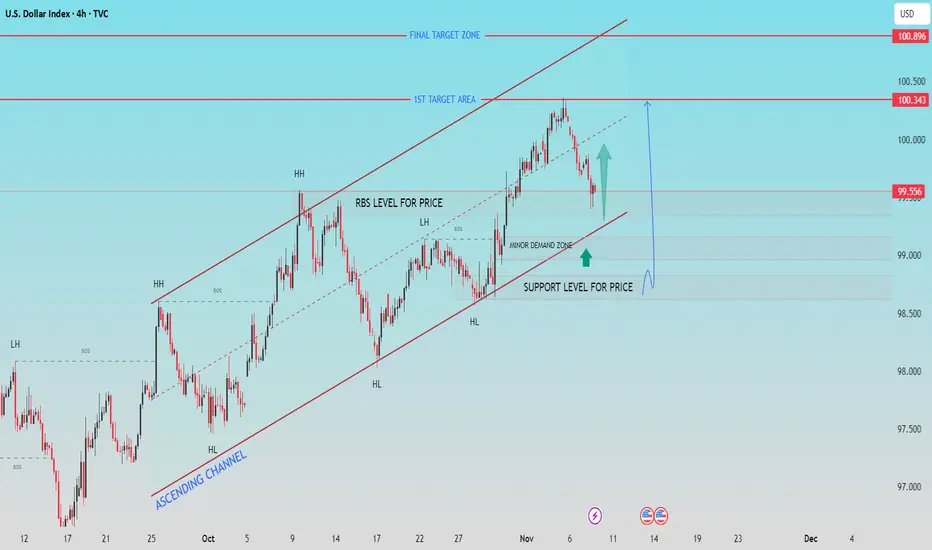
The DXY is trading within an ascending channel, maintaining a clear structure of higher highs (HH) and higher lows (HL). This indicates that the broader trend remains bullish as long as the lower boundary of the channel holds.
▪Key Levels:
▫Support Zone: Around 99.00 – 99.30, aligned with the channel’s lower boundary and a minor demand zone.
▫Resistance Zones:
▫1st Target Area: Near 100.34
▫Final Target Zone: Around 100.89 – 101.00
The RBS (Resistance Becomes Support) level near 99.50 adds further confluence for potential bullish reactions.
▪Price Outlook:
Price is currently retracing toward the support level within the channel. A bullish reversal from this area could push DXY back toward the 100.34 resistance and possibly the final target zone near 101.00.
However, a break below 99.00 would invalidate the bullish structure and expose deeper support toward 98.50.
▪Summary
Bias: Bullish while above 99.00 support.
Short-Term Target: 100.34
Extended Target: 100.89 – 101.00
Invalidation: Sustained break below 99.00
If this helpful for you, press the like button.
▪Market Structure:
The DXY is trading within an ascending channel, maintaining a clear structure of higher highs (HH) and higher lows (HL). This indicates that the broader trend remains bullish as long as the lower boundary of the channel holds.
▪Key Levels:
▫Support Zone: Around 99.00 – 99.30, aligned with the channel’s lower boundary and a minor demand zone.
▫Resistance Zones:
▫1st Target Area: Near 100.34
▫Final Target Zone: Around 100.89 – 101.00
The RBS (Resistance Becomes Support) level near 99.50 adds further confluence for potential bullish reactions.
▪Price Outlook:
Price is currently retracing toward the support level within the channel. A bullish reversal from this area could push DXY back toward the 100.34 resistance and possibly the final target zone near 101.00.
However, a break below 99.00 would invalidate the bullish structure and expose deeper support toward 98.50.
▪Summary
Bias: Bullish while above 99.00 support.
Short-Term Target: 100.34
Extended Target: 100.89 – 101.00
Invalidation: Sustained break below 99.00
If this helpful for you, press the like button.
Disclaimer
The information and publications are not meant to be, and do not constitute, financial, investment, trading, or other types of advice or recommendations supplied or endorsed by TradingView. Read more in the Terms of Use.
Disclaimer
The information and publications are not meant to be, and do not constitute, financial, investment, trading, or other types of advice or recommendations supplied or endorsed by TradingView. Read more in the Terms of Use.