DYDX is once again testing its major demand zone between $0.53 and $0.58, an area that has consistently acted as a strong defensive wall for buyers over the past several months.
Each dip into this region has triggered a solid rebound — suggesting institutional or large-scale accumulation at the bottom of the range. However, with momentum fading and volume drying up, this support zone is now under serious pressure.
---
Market Structure & Technical Pattern
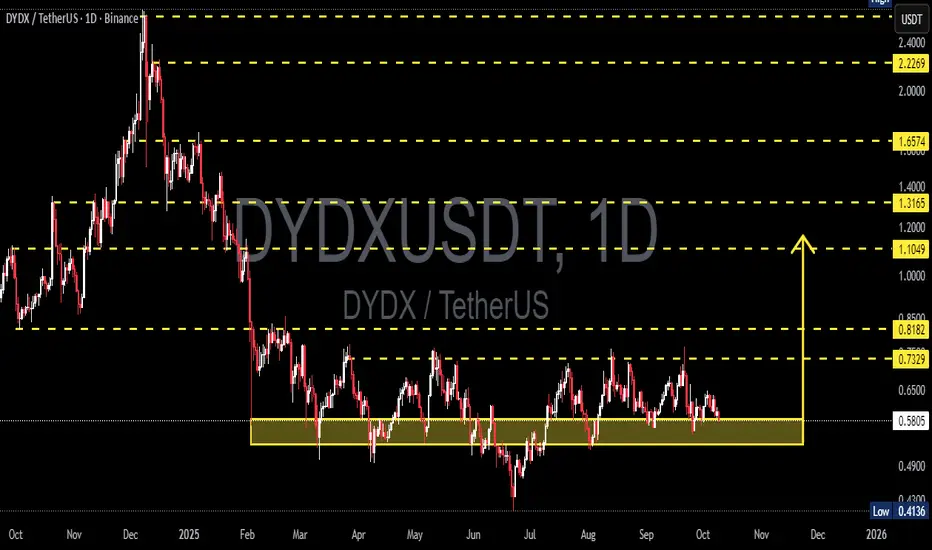
Primary trend: DYDX remains in a broad consolidation phase following its steep decline from the $2.2 peak.
Dominant pattern: Horizontal accumulation base — the price is trapped between a solid support zone at $0.53–$0.58 and strong resistance at $0.73–$0.82.
Market sentiment: Neutral-to-bearish; buyers still defend the base, but bullish momentum has yet to show meaningful confirmation.
At this point, the reaction around $0.53–$0.58 will determine DYDX’s next macro direction — whether it’s ready to rebound or fall into a deeper correction.
---
Bullish Scenario — Rebound from the Accumulation Zone
If DYDX holds above $0.53 and confirms a bounce with increasing volume and higher lows, the pair could initiate a mid-term reversal setup.
Breakout confirmation would occur once price breaks:
$0.73 (initial resistance) → leading to
$0.82, and then
$1.10 and $1.31 as the next targets.
As long as $0.53 remains intact, this base may serve as a launchpad for the next impulsive move upward.
---
Bearish Scenario — Breakdown Below Support
Conversely, if DYDX closes a daily candle below $0.53, the accumulation structure will shift into a distribution phase, signaling continuation of the broader downtrend.
Potential downside targets include:
$0.41 (previous low),
and if selling pressure extends, $0.30–$0.35 could be revisited.
A breakdown below $0.53 could trigger short-term capitulation, as this area has acted as a strong demand zone since early 2025.
---
Conclusion
DYDX is now sitting at a critical decision zone between $0.53 and $0.58 — a level that has defined the market structure for months.
Buyers still show resilience, but the market demands volume confirmation and a structural breakout to signal true bullish reversal.
As long as the base holds, the probability of recovery remains alive.
But a daily close below $0.53 would likely confirm a breakdown and a shift to a bearish continuation phase.
--
#DYDX #DYDXUSDT #CryptoAnalysis #TechnicalAnalysis #SupportResistance #BreakoutSetup #AccumulationZone #AltcoinAnalysis #CryptoTrading #DeFiToken #MarketStructure #PriceAction #CryptoInsights
Each dip into this region has triggered a solid rebound — suggesting institutional or large-scale accumulation at the bottom of the range. However, with momentum fading and volume drying up, this support zone is now under serious pressure.
---
Market Structure & Technical Pattern
Primary trend: DYDX remains in a broad consolidation phase following its steep decline from the $2.2 peak.
Dominant pattern: Horizontal accumulation base — the price is trapped between a solid support zone at $0.53–$0.58 and strong resistance at $0.73–$0.82.
Market sentiment: Neutral-to-bearish; buyers still defend the base, but bullish momentum has yet to show meaningful confirmation.
At this point, the reaction around $0.53–$0.58 will determine DYDX’s next macro direction — whether it’s ready to rebound or fall into a deeper correction.
---
Bullish Scenario — Rebound from the Accumulation Zone
If DYDX holds above $0.53 and confirms a bounce with increasing volume and higher lows, the pair could initiate a mid-term reversal setup.
Breakout confirmation would occur once price breaks:
$0.73 (initial resistance) → leading to
$0.82, and then
$1.10 and $1.31 as the next targets.
As long as $0.53 remains intact, this base may serve as a launchpad for the next impulsive move upward.
---
Bearish Scenario — Breakdown Below Support
Conversely, if DYDX closes a daily candle below $0.53, the accumulation structure will shift into a distribution phase, signaling continuation of the broader downtrend.
Potential downside targets include:
$0.41 (previous low),
and if selling pressure extends, $0.30–$0.35 could be revisited.
A breakdown below $0.53 could trigger short-term capitulation, as this area has acted as a strong demand zone since early 2025.
---
Conclusion
DYDX is now sitting at a critical decision zone between $0.53 and $0.58 — a level that has defined the market structure for months.
Buyers still show resilience, but the market demands volume confirmation and a structural breakout to signal true bullish reversal.
As long as the base holds, the probability of recovery remains alive.
But a daily close below $0.53 would likely confirm a breakdown and a shift to a bearish continuation phase.
--
#DYDX #DYDXUSDT #CryptoAnalysis #TechnicalAnalysis #SupportResistance #BreakoutSetup #AccumulationZone #AltcoinAnalysis #CryptoTrading #DeFiToken #MarketStructure #PriceAction #CryptoInsights
✅ Get Free Signals! Join Our Telegram Channel Here: t.me/TheCryptoNuclear
✅ Twitter: twitter.com/crypto_nuclear
✅ Join Bybit : partner.bybit.com/b/nuclearvip
✅ Benefits : Lifetime Trading Fee Discount -50%
✅ Twitter: twitter.com/crypto_nuclear
✅ Join Bybit : partner.bybit.com/b/nuclearvip
✅ Benefits : Lifetime Trading Fee Discount -50%
Disclaimer
The information and publications are not meant to be, and do not constitute, financial, investment, trading, or other types of advice or recommendations supplied or endorsed by TradingView. Read more in the Terms of Use.