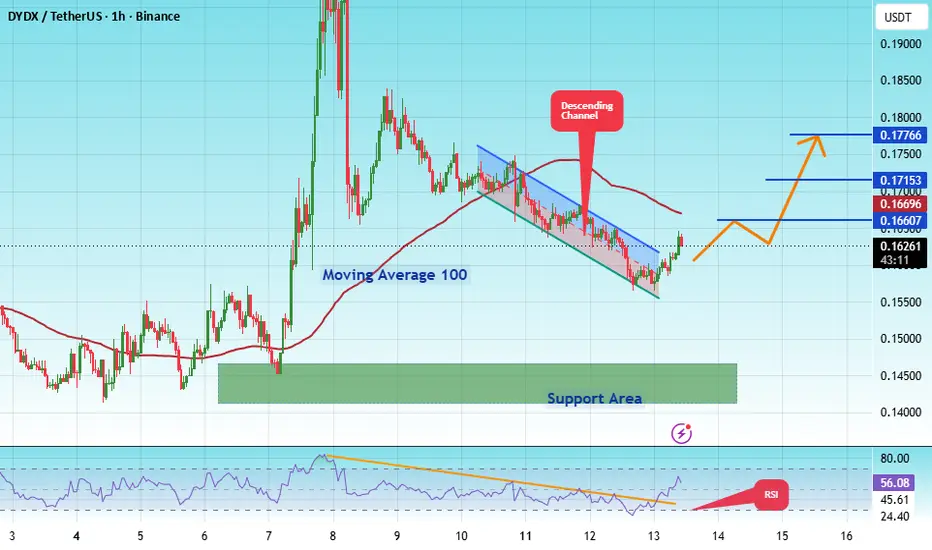
#DYDXUSDT Breakout from Falling Wedge #DYDX
The price is moving within a descending channel on the 1-hour timeframe; it has reached the lower boundary and appears poised for a rebound, suggesting a potential upward move upon retesting this level.
The Relative Strength Index (RSI) indicates a bearish trend, but an upward breakout is likely due to oversold conditions on the 1-hour chart.
An orange trend line supports the potential upward rebound.
There is initial support at 0.1290, acting as a primary support zone.
A key support
Dydxusdtlong
#DYDXUSDT Breakout from Falling Wedge |#DYDX
The price is moving within a descending channel on the 1-hour timeframe; it has reached the lower boundary and is poised for a rebound. A retest of this boundary is expected, supporting some upward movement.
The Relative Strength Index (RSI) indicates a bearish trend, but an upward breakout is likely due to oversold conditions on the 1-hour chart.
There is initial support at 0.1066 acting as a primary support zone.
A key support zone (marked in green) exists at 0.1000; the price has re
#DYDXUSDT Breakout from Falling Wedge |#DYDX
The price is moving within a descending channel on the 1-hour timeframe and has reached the lower boundary. It is now poised for a bounce and is expected to retest this boundary.
The Relative Strength Index (RSI) indicates a downward trend, which is likely to continue given the overbought conditions.
There is a key support zone in green at 0.09768, and the price has bounced off this zone several times, making it a strong support level.
The price is trending towards the 100-period movin
DYDX Trapped Under Resistance — Breakout or Breakdown?📊 Technical Analysis — DYDX/USDT
⏳ Time Frame: 2D
💱 Pair: DYDX/USDT
📍 Current Price: around $0.113
The DYDX chart is currently showing a consolidation structure that is becoming increasingly compressed beneath the Descending Trendline, while price continues to receive reactions from the $0.094–$0.080 demand/support zone.
This structure is particularly interesting because the longer price remains within a narrowing range, the greater the potential for a strong expansion/breakout once one side o
#DYDX/USDT Breakout from Falling Wedge |#DYDX
The price is moving within a descending channel on the 1-hour timeframe and has reached the lower boundary. It is now poised for a bounce and is expected to retest this boundary.
The Relative Strength Index (RSI) indicates a downward trend, which is likely to continue given the overbought conditions.
There is a key support zone in green at 0.1097, and the price has bounced off this zone several times, making it a strong support level.
The price is trending towards the 100-period moving
#DYDX/USDT Breakout from Falling Wedge |#DYDX
The price is moving within a descending channel on the 1-hour timeframe and has reached the lower boundary. It is now poised for a bounce and is expected to retest this boundary.
The Relative Strength Index (RSI) indicates a downward trend, which is likely to continue given the overbought conditions.
There is a key support zone in green at 0.09800, and the price has bounced off this zone several times, making it a strong support level.
The price is trending towards the 100-period movin
#DYDX/USDT Breakout from Falling Wedge |#DYDX
The price is moving within a descending channel on the 1-hour timeframe and has reached the lower boundary. It is now poised for a bounce and is expected to retest this boundary.
The Relative Strength Index (RSI) indicates a downward trend, which is likely to continue given the overbought conditions.
There is a key support zone in green at 0.11470, and the price has bounced off this zone several times, making it a strong support level.
The price is trending towards the 100-period movin
#DYDX/USDT Breakout from Falling Wedge |#DYDX
The price is moving within a descending channel on the 1-hour timeframe and has reached the lower boundary. It is now poised for a bounce and is expected to retest this boundary.
The Relative Strength Index (RSI) indicates a downward trend, which is likely to continue given the overbought conditions.
There is a key support zone in green at 0.1412, and the price has bounced off this zone several times, making it a strong support level.
The price is trending towards the 100-period moving
#DYDUSDT Ready to go higher#DYD
The price is moving within a descending channel on the hourly timeframe. It has reached the lower boundary and is trending towards a bounce. A retest of this boundary is expected.
The Relative Strength Index (RSI) indicates a downward trend, and this trend is likely to continue due to the overbought condition.
A key support zone (in green) was found at 0.0891, and the price has bounced off this zone several times, making it a strong support level.
The price is trending towards the 100-p
#DYDX/USDT Breakout from Falling Wedge |#DYDX
The price is moving within a descending channel on the hourly timeframe. It has reached the lower boundary and is heading towards a breakout, with a retest of the upper boundary expected.
The Relative Strength Index (RSI) is showing a downward trend, approaching the lower boundary, and an upward bounce is anticipated.
There is a key support zone in green at 0.1027, and the price has bounced from this level several times and is expected to bounce again.
The indicator is showing a trend
DYDX/USDT - Strong Bearish Channel Still Dominates the MarketDYDX/USDT is currently moving within a well-structured bearish trend on the daily timeframe. Price action continues to respect a descending channel, indicating that selling pressure remains dominant. As long as price stays inside this channel, the overall market structure remains bearish.
---
Pattern Explanation
The primary pattern visible on the chart is a Descending Channel (Bearish Channel):
Upper trendline (red) acts as dynamic resistance
Lower trendline (yellow) acts as dynamic suppor
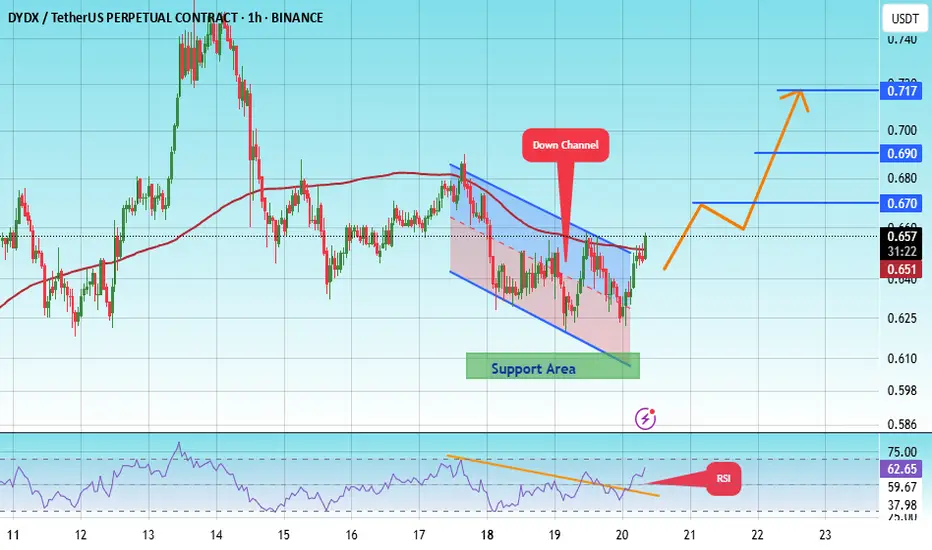
#DYDX/USDT#DYDX
The price is moving within a descending channel on the 1-hour frame, adhering well to it, and is on its way to breaking strongly upwards and retesting it.
We have support from the lower boundary of the descending channel, at 0.640.
We have a downtrend on the RSI indicator that is about to be broken and retested, supporting the upside.
There is a major support area in green at 0.638, which represents a strong basis for the upside.
Don't forget a simple thing: ease and capital.
When yo
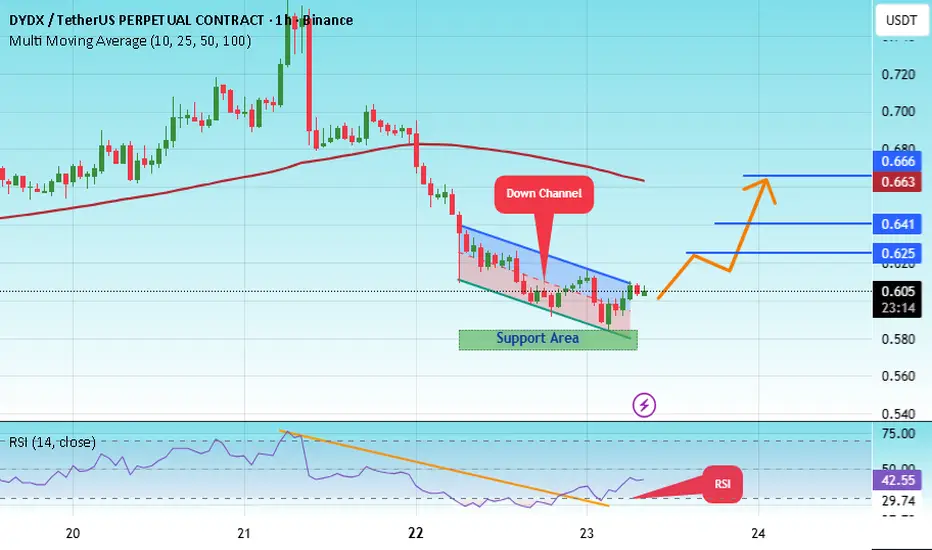
#DYDX/USDT Breakout from Falling Wedge |#DYDX
The price is moving within a descending channel on the 1-hour frame, adhering well to it, and is heading for a strong breakout and retest.
We have a bearish trend on the RSI indicator that is about to be broken and retested, which supports the upward breakout.
There is a major support area in green at 0.577, representing a strong support point.
We are heading for consolidation above the 100 moving average.
Entry price: 0.603
First target: 0.625
Second target: 0.641
Third target: 0.663
#DYDX/USDT Secondary Trend. Capitulation Zone. Wedge #DYDX
The price is moving within a descending channel on the 1-hour frame, adhering well to it, and is heading for a strong breakout and retest.
We have a bearish trend on the RSI indicator that is about to be broken and retested, which supports the upward breakout.
There is a major support area in green at 0.595, representing a strong support point.
We are heading for consolidation above the 100 moving average.
Entry price: 0.615
First target: 0.626
Second target: 0.638
Third target: 0.652
#DYDX/USDT Secondary Trend. Capitulation Zone. Wedge#DYDX
The price is moving within a descending channel on the hourly timeframe. It has reached the lower boundary and is heading towards a breakout, with a retest of the upper boundary expected.
The Relative Strength Index (RSI) is showing a downward trend, approaching the lower boundary, and an upward bounce is anticipated.
There is a key support zone in green at 0.1690. The price has bounced from this level several times and is expected to bounce again.
The indicator is showing a trend towa
DYDX About to Explode or Collapse? Yello, have you seen what #DYDX is doing right now? This textbook falling wedge is running out of space, and the next move will either trap late sellers or leave sidelined bulls chasing.
💎#DYDXUSDT has broken out of its falling wedge pattern, and we’re now waiting for a clean retest of the breakout zone. Once that retest is confirmed, there’s a high probability of a bullish continuation move.
💎Previously, we saw price dip below the descending support, but that breakdown was quickly absorbed by
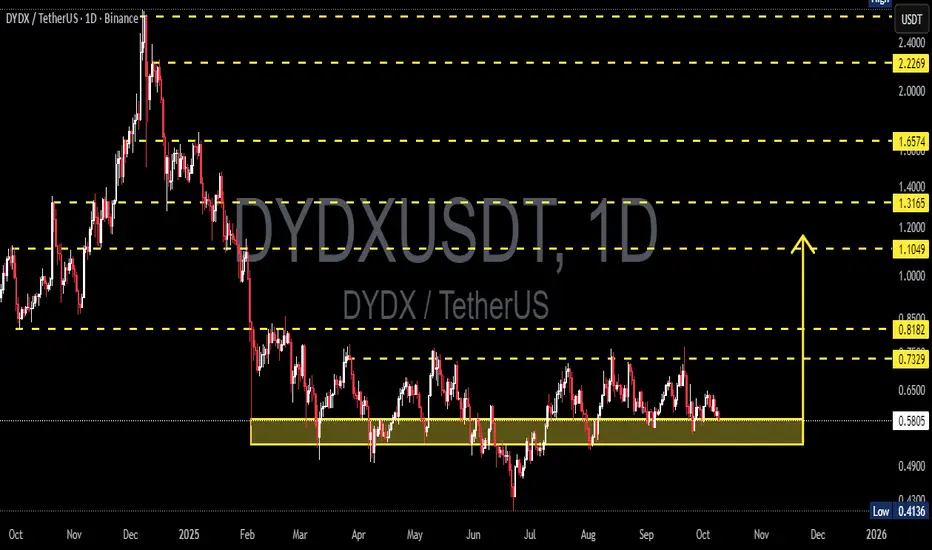
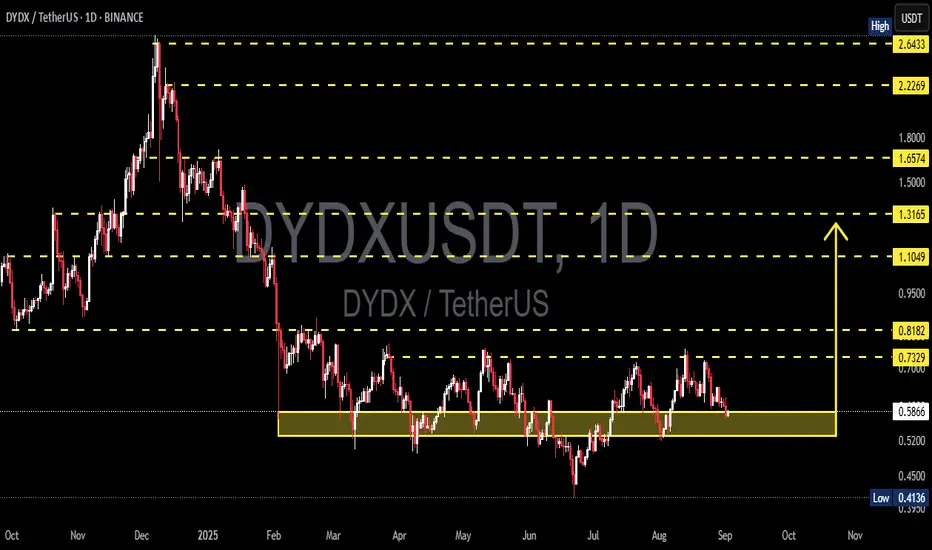
DYDX/USDT — Buyers on the Edge, Breakout or Breakdown?DYDX is once again testing its major demand zone between $0.53 and $0.58, an area that has consistently acted as a strong defensive wall for buyers over the past several months.
Each dip into this region has triggered a solid rebound — suggesting institutional or large-scale accumulation at the bottom of the range. However, with momentum fading and volume drying up, this support zone is now under serious pressure.
---
Market Structure & Technical Pattern
Primary trend: DYDX remains in a broa
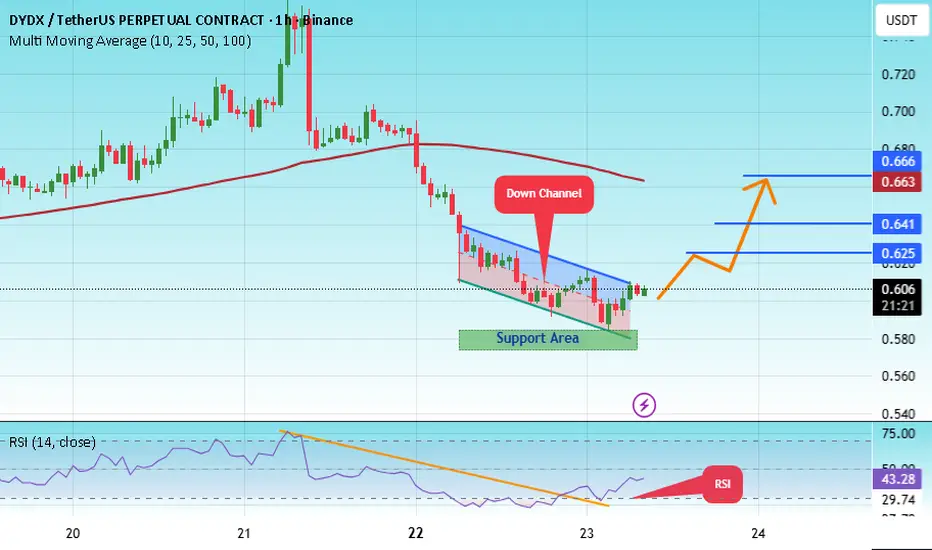
#DYDX/USDT Breakout from Falling Wedge |
#DYDX
The price is moving within a descending channel on the 1-hour frame, adhering well to it, and is heading for a strong breakout and retest.
We have a bearish trend on the RSI indicator that is about to be broken and retested, which supports the upward breakout.
There is a major support area in green at 0.577, representing a strong support point.
We are heading for consolidation above the 100 moving average.
Entry price: 0.603
First target: 0.625
Second target: 0.641
Third target: 0.6
DYDXUSDT UPDATE#DYDX
UPDATE
DYDX Technical Setup
Pattern : Bullish Falling Wedge Pattern
Current Price: $0.6186
Target Price: $0.78
Target % Gain: 25.35%
Technical Analysis: DYDX has broken out of a falling wedge on the 4H chart, confirming bullish momentum. The structure shows strong breakout with potential continuation towards $0.78 as long as price holds above the breakout zone.
Time Frame: 4H
Risk Management Tip: Always use proper risk management.
#DYDX/USDT#DYDX
The price is moving within an ascending channel on the 1-hour frame, adhering well to it, and is on track to break it strongly upwards and retest it.
We have support from the lower boundary of the ascending channel, at 0.612.
We have a downtrend on the RSI indicator that is about to break and retest, supporting the upside.
There is a major support area in green at 0.606, which represents a strong basis for the upside.
Don't forget a simple thing: ease and capital.
When you reach the
DYDX/USDT — Testing Historical Support: Bounce or Breakdown?Full Analysis:
DYDX is currently standing at a critical decision point. The chart shows price retesting the demand zone $0.50–$0.59 (yellow box), which has acted as strong support multiple times since March, June, and August 2025. This zone remains the last stronghold before price revisits the previous low at $0.41.
On the macro view, DYDX is still in a downtrend since the peak at $2.64 (Dec 2024). However, in the mid-term, price is moving sideways inside a broad range of $0.41–$0.82, suggesti
DYDXUSDT Forming Bullish PotentialDYDXUSDT is currently showing strong bullish potential as price action is forming a higher-low structure, signaling accumulation before the next breakout. The chart highlights a critical resistance zone where multiple rejections have occurred in the past, but this time volume and investor sentiment are suggesting a possible breakout to the upside. With good volume supporting the move, DYDXUSDT appears to be setting up for a strong bullish wave.
The expected gain of 40% to 50%+ makes DYDXUSDT an
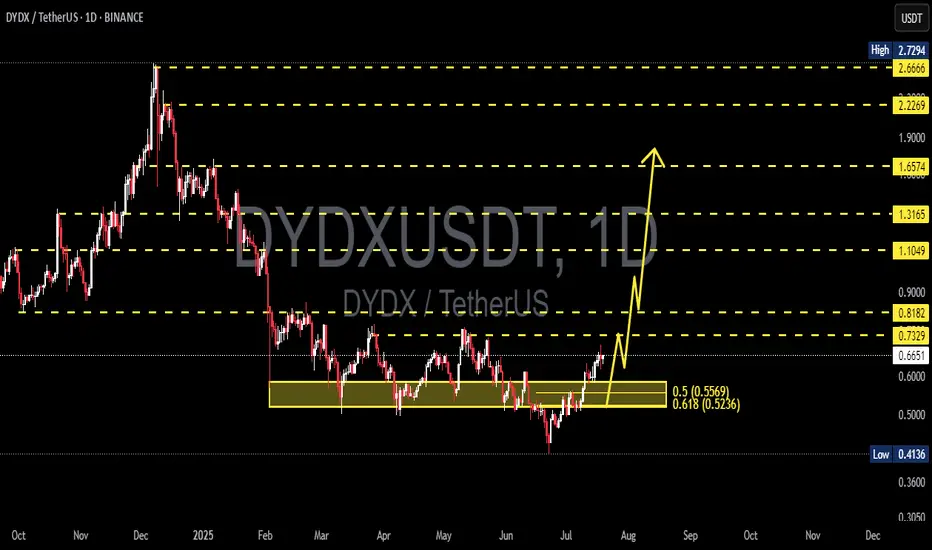
DYDX/USDT Poised for a Massive Breakout – Is a Rally Toward $2+?✨ Comprehensive and Engaging Technical Analysis:
DYDX/USDT is entering a highly compelling technical phase, showing signs of a potential trend reversal after breaking out from a prolonged accumulation zone that lasted nearly 5 months. This breakout on the daily timeframe (1D) is a classic early signal for a major upward move — often favored by swing traders and mid-term investors.
🔍 Accumulation Zone & Fibonacci Golden Pocket
The range between $0.52 and $0.56 represents the Fibonacci retracem
#DyDx Superb opportunity#DYDX
The price is moving within a descending channel on the 1-hour frame, adhering well to it, and is on its way to breaking it strongly upwards and retesting it.
We have a bounce from the lower boundary of the descending channel. This support is at 0.470.
We have a downtrend on the RSI indicator that is about to be broken and retested, supporting the upside.
There is a major support area in green at 0.445, which represents a strong basis for the upside.
Don't forget a simple thing: ease a