🔎 Current Market Outlook
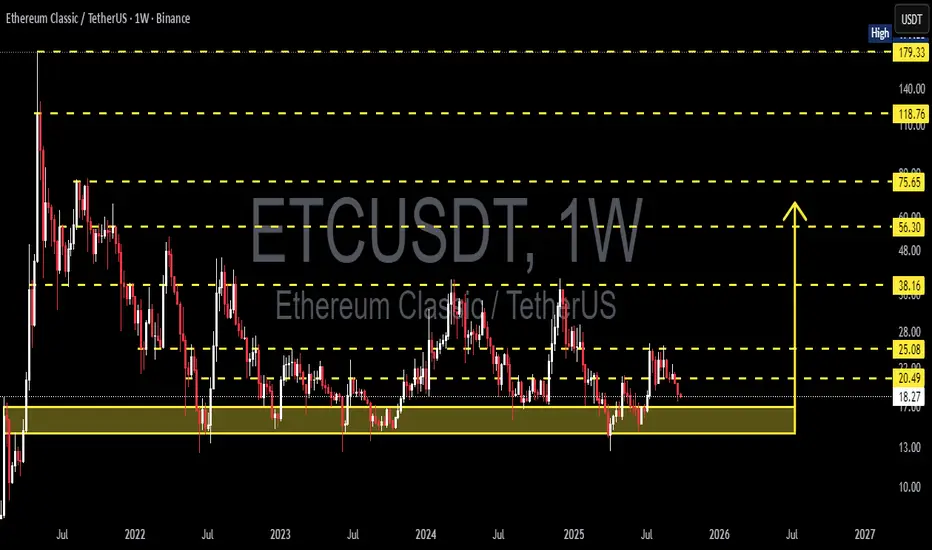
Current price: ~20.49 USDT
Price is approaching the critical support zone at 17–14 USDT (highlighted yellow).
This area has acted as a multi-year demand zone since 2021, where buyers repeatedly defended the level and triggered rebounds.
However, ETC has consistently failed to break major resistance levels, forming lower highs within a prolonged sideways range.
This makes the 17–14 zone a decision point: will buyers once again absorb supply and push for a rebound, or will sellers finally break the structure and trigger a deeper bearish trend?
---
📐 Market Structure & Price Pattern
1. Major Support Zone (17–14 USDT):
Tested multiple times since 2021.
Holding above → suggests strong accumulation.
Breaking below → could end the long-term sideways trend.
2. Key Resistance Levels:
25.08 USDT → first resistance to watch for breakout.
38.16 USDT → medium-term resistance.
56.30 & 75.65 USDT → major long-term supply zones.
Higher targets: 118.76 & 179.33 USDT (only relevant in a super bullish cycle).
3. Price Pattern:
Large sideways structure with lower highs.
Repeated tests of 17–14 → showing this demand zone is still crucial for market direction.
---
🐂 Bullish Scenario (If Buyers Defend)
Confirmation: Weekly close above 25.08 with strong volume.
Implication: Signals a new higher high on the weekly timeframe.
Targets:
TP1 → 38.16
TP2 → 56.30
TP3 → 75.65
Key Note: As long as 17–14 holds, ETC remains in accumulation territory with potential for a strong rebound in the next bullish phase.
---
🐻 Bearish Scenario (If Sellers Break Through)
Confirmation: Weekly close below 14 USDT.
Implication: Multi-year demand zone is invalidated.
Targets: Without solid support below, price could drop towards the psychological 10 USDT level or even lower.
Warning: A breakdown here would mark the end of the long-term sideways phase and trigger a deeper bearish leg.
---
🎯 Trading Strategy & Risk Management
1. Conservative Approach:
Wait for breakout >25.08 → enter long.
Targets: 38.16–56.30.
Stop loss below 22.
2. Aggressive Approach (buy the zone):
Enter within 17–14.
Stop loss below 14.
First target 25.08, scale out at 38.16.
3. Short Setup:
Only valid if weekly close <14 (confirmed breakdown).
Short-term target: 12 → 10 USDT.
⚠️ Note: This is a high risk/reward zone. Position sizing and clear stop-loss levels are critical.
---
✨ Conclusion
The 17–14 USDT support zone is ETC’s lifeline.
Holding above → accumulation continues, with rebound potential toward 25.08 → 38.16.
Breaking below 14 → long-term bearish breakdown with risk of a sharp decline.
Breakout above 25.08 → the first real trigger of a bullish trend reversal.
ETC is at a make-or-break moment. Traders should closely watch how weekly candles react around 17–14.
---
#ETC #EthereumClassic #Crypto #Altcoins #TechnicalAnalysis #PriceAction #SwingTrade #SupportResistance #CryptoAnalysis #ChartPatterns
✅ Get Free Signals! Join Our Telegram Channel Here: t.me/TheCryptoNuclear
✅ Twitter: twitter.com/crypto_nuclear
✅ Join Bybit : partner.bybit.com/b/nuclearvip
✅ Benefits : Lifetime Trading Fee Discount -50%
✅ Twitter: twitter.com/crypto_nuclear
✅ Join Bybit : partner.bybit.com/b/nuclearvip
✅ Benefits : Lifetime Trading Fee Discount -50%
Disclaimer
The information and publications are not meant to be, and do not constitute, financial, investment, trading, or other types of advice or recommendations supplied or endorsed by TradingView. Read more in the Terms of Use.